 UPDF for Windows
 UPDF for Mac
 UPDF for iPhone/iPad
 UPDF for Android
 UPDF AI Online
 UPDF Sign
 IvyCraft
 Edit PDF
 Annotate PDF
 Create PDF
 PDF Form
 Edit links
 Convert PDF
 OCR
OCR PDF to Word
 PDF to Image
 PDF to Excel
 Organize PDF
 Merge PDF
 Split PDF
 Crop PDF
 Rotate PDF
 Protect PDF
 Sign PDF
 Redact PDF
 Sanitize PDF
 Remove Security
 Read PDF
 UPDF Cloud
 Compress PDF
 Print PDF
 Batch Process
 About UPDF AI
 UPDF AI Solutions
 AI User Guide
 FAQ about UPDF AI
 Summarize PDF
 Translate PDF
 Chat with PDF
 Chat with AI
 Chat with image
 PDF to Mind Map
 Explain PDF
 PDF AI Tools
 Image AI Tools
 AI Chat Tools
 AI Writing Tools
 AI Study Tools
 AI Working Tools
 Other AI Tools
 AI Bookmark Generation
 AI Bookmark Summary
 AI Watermark Generation
 AI Background Generation
 AI Sticker Generation
 AI Stamp Generation
 AI Editing Suite
 UPDF Copilot
 AI Page Management
 AI Semantic Search
 PDF to Word
 PDF to Excel
 PDF to PowerPoint
 User Guide
 UPDF Tricks
 FAQs
FAQs UPDF Reviews
 Download Center
 Blog
Blog Newsroom
 Tech Spec
 Updates
 UPDF vs. Adobe Acrobat
 UPDF vs. Foxit
 UPDF vs. PDF Expert
When it comes to project management, staying organized and on top of timelines is pivotal for success. One tool that has become increasingly popular for this purpose is Gantt charts. Gantt charts are visual representations of project schedules that help users break down complex projects into manageable tasks and track progress over time.
There are a variety of Gantt chart software options available on the market, each with its own unique features and benefits. In this article, we will explore the top five Gantt chart options and highlight their key features to help you decide which one is best for your project management needs.
We will start with a brief overview of Gantt charts and how they work. Then, we will dive into the top five Gantt chart options, including their pros and cons, and provide examples of how they can be used in real-world scenarios. This article also includes a rundown of a UPDF and the benefits of the program and how companies can utilize this to create annotated PDF documents or secure encryption of documents.
Windows • macOS • iOS • Android 100% secure
Whether you are a project manager looking for a new tool to streamline your workflow or a team member who wants to better understand project timelines, this article will provide valuable insights into the top Gantt chart options available today.
What is a Gantt Chart?
A Gantt chart is a project management tool that provides a visual representation of a project's timeline. It was developed by Henry Gantt in the early 20th century and has since become an essential tool for project managers in various industries.

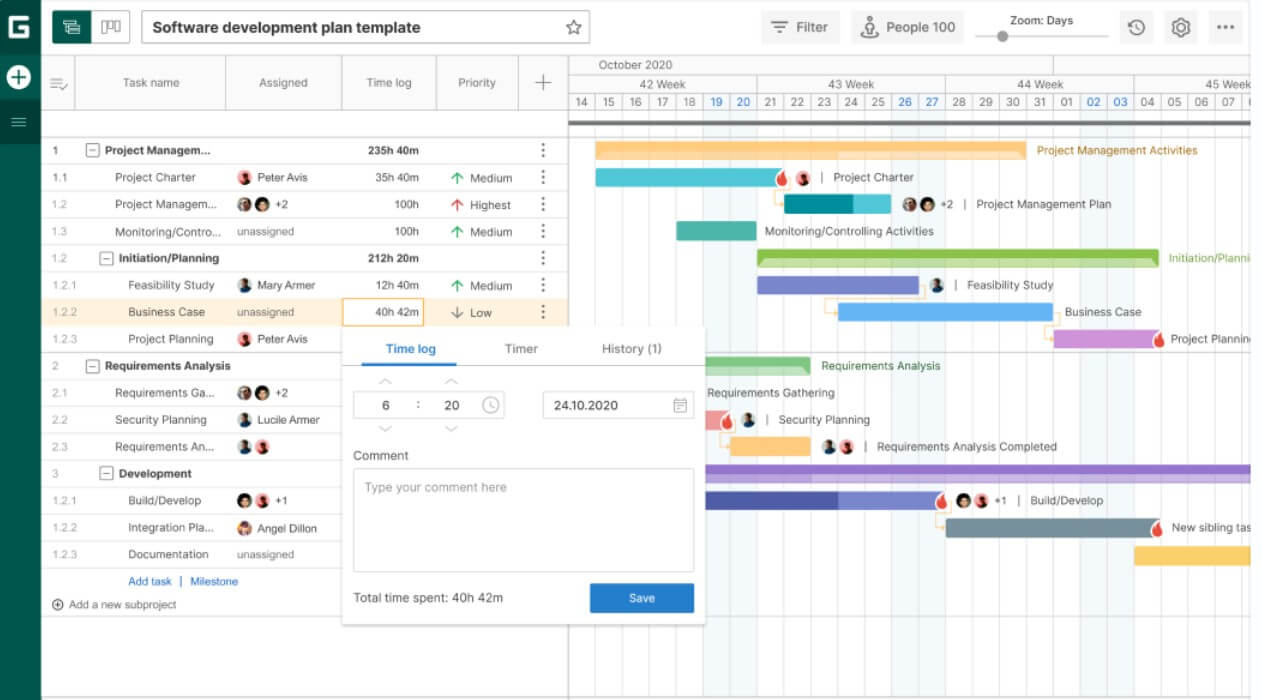
A Gantt chart uses horizontal bars to represent project tasks and their duration. The chart is divided into columns that represent time periods, usually days, weeks, or months. Each task is assigned a var that spans across the relevant time period, with the length of the bar representing the duration of the task.
Gantt charts also include dependencies between tasks, which indicate the order in which tasks must be completed. For example, if Task B cannot start until Task A is completed, there will be a dependency arrow between the two tasks on the chart.
Gantt charts can be used to track project progress, identify potential delays or bottlenecks, and communicate project timelines to stakeholders. They are particularly useful for complex projects with multiple interdependent tasks.
There are many software options available for creating Gantt charts, ranging from basic spreadsheet tools to more advanced project management software. Some software even allows for real-time collaboration and automatic updates to keep everyone on the same page.
Overall, a Gantt chart is a powerful project management tool that helps teams stay achieving project goals.
The Benefits and Importance of Using a Gantt Chart Software
A Gantt chart software is a project management tool that provides a visual representation of a project's timeline. It helps project managers plan, schedule, and track project progress more efficiently, and communicate project timelines to stakeholders more effectively.
One of the main benefits of using Gantt chart software is that it allows project managers to break down complex projects into smaller, more manageable tasks. By assigning tasks to team members, setting deadlines, and tracking progress, project managers can ensure that the project stays on track and that everyone is aware of their responsibilities.
Another benefit of using Gantt chart software is that it helps project managers identify potential bottlenecks and delays in the project timeline. By identifying these issues early on, project managers can take corrective action to mitigate any negative impact on the project.
Gantt chart software also allows for real-time collaboration and communication between team members. Team members can update their progress on assigned tasks, and project managers can quickly see the status of the project as a whole. This helps to ensure that everyone is working towards the same goal and that communication is clear and transparent.
Using Gantt chart software is necessary for effective project management. It helps project managers stay organized, on track, and focused on achieving project goals. With the right software, project managers can streamline project management, improve communication and ensure project success.
5 Free Online and Offline Gantt Chart Makers
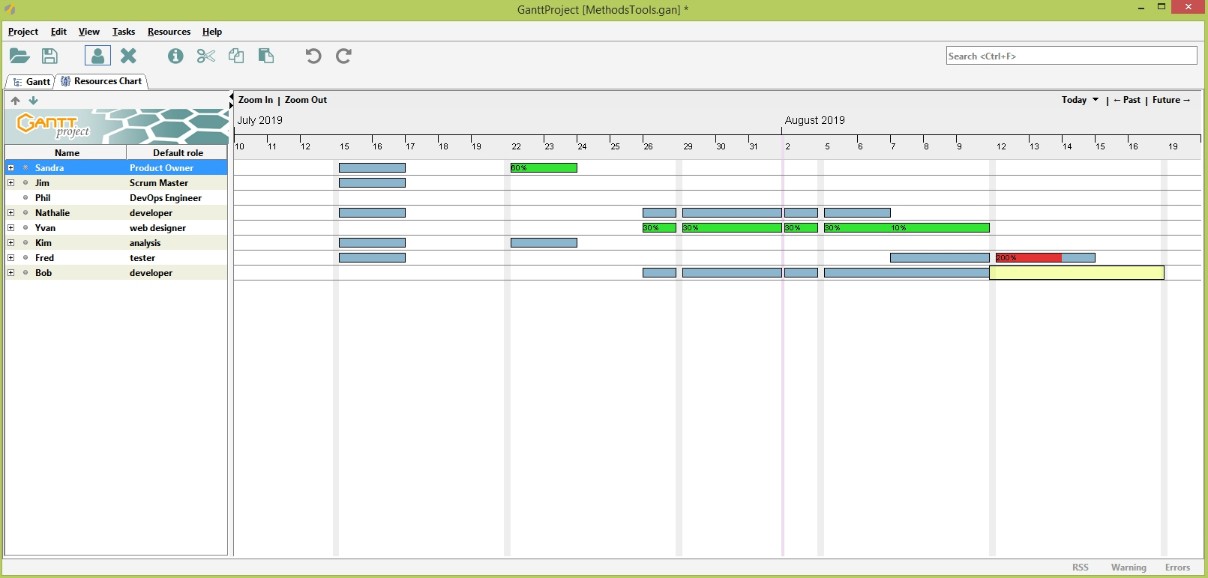
1. GanttProject:
GanttProject is a free, open-source Gantt software that allows users to create Gantt charts, assign tasks to team members, and track project progress. The software is available on Windows, Mac, and Linux.
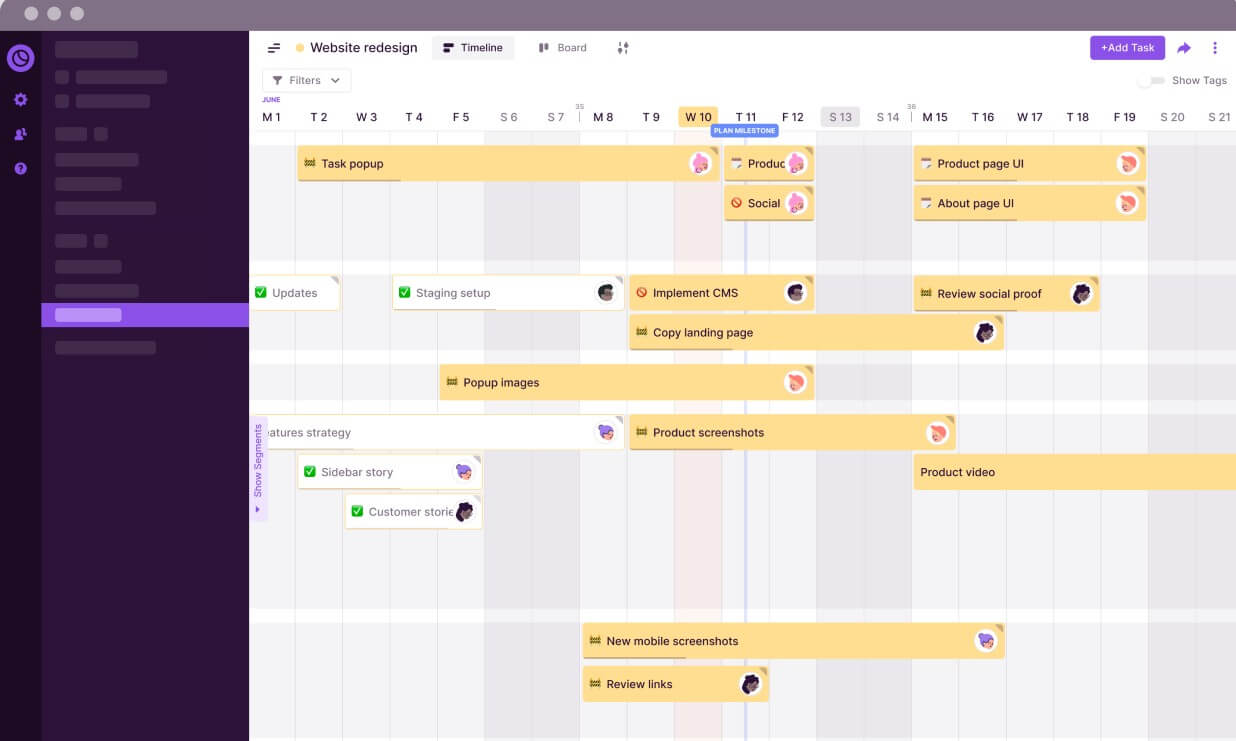
2. Toggl Plan:
Toggl Plan is an online Gantt chart software that includes a Gantt chart feature. Users can create Gantt charts with it. It also allows users to assign tasks, as well as track the project's progress. Toggle Plan offers a free plan for up to five users.
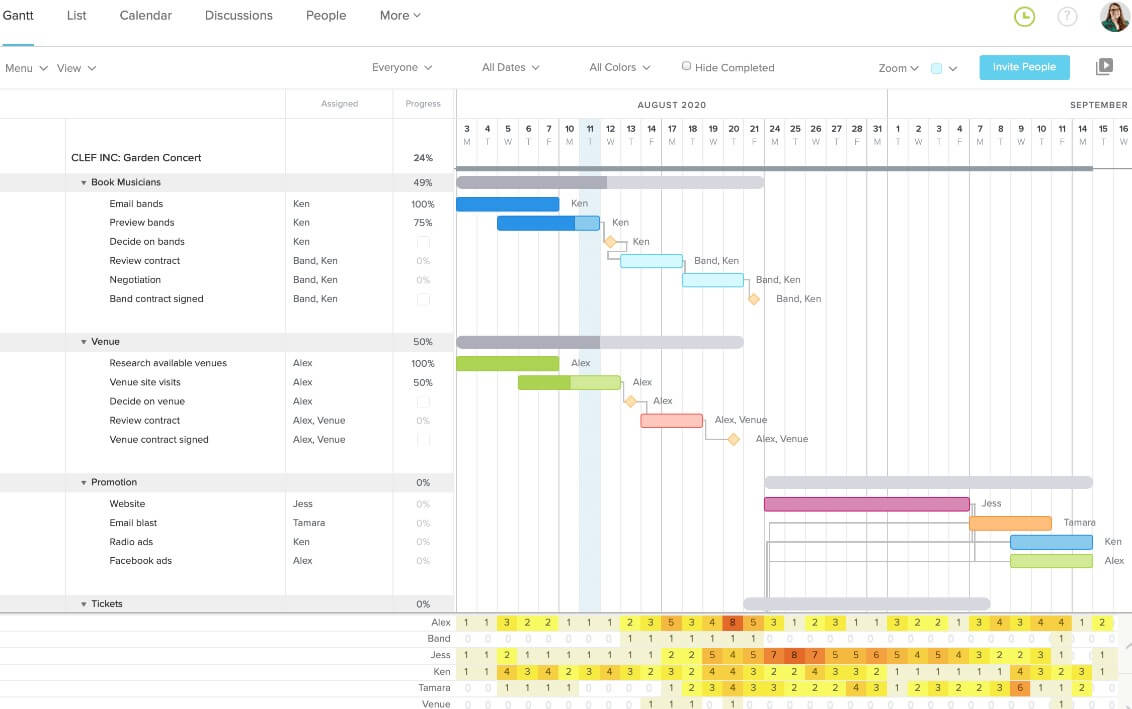
3. TeamGantt:
TeamGantt is an online Gantt chart tool that offers Gantt chart functionality. Creating Gantt charts with this tool is easy. The software also includes collaboration features and integrations with other tools such as Trello and Asana.
4. ClickUp:
ClickUp is another web-based Gantt software that includes a Gantt chart feature. Users can create Gantt charts, assign tasks, and track project progress. ClickUp also offers a free plan for up to 100MB of storage.
5. GanttPRO:
GanttPRO is the last tool that offers a Gantt chart feature. Users can create Gantt charts, assign tasks, and track project progress. GanttPro also includes collaboration features and integrations with other tools such as Trello and Slack. A free trial is available for new users.
Overall, these free online and offline Gantt chart makers provide users with a range of options for creating and managing Gantt charts. Whether you're looking for a basic tool or a more robust project management solution, there's something on this list for everyone.
Another Must-Have Software for Project Managers
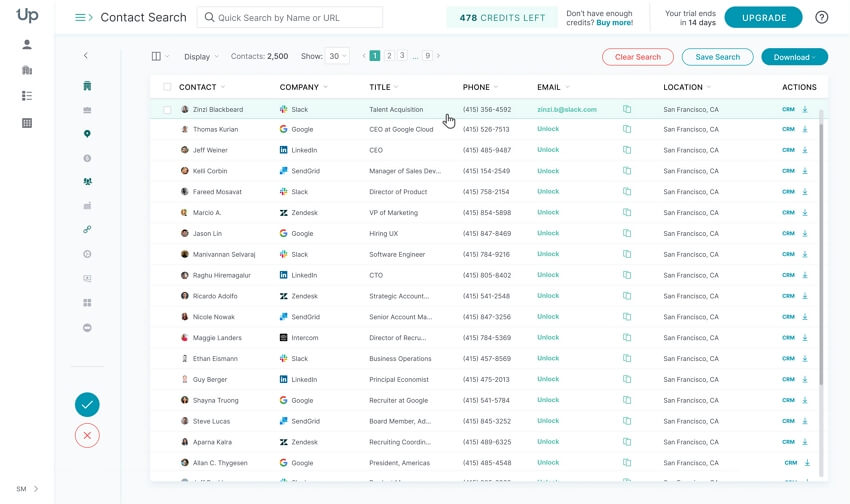
UPDF is a complete PDF solution that offers a range of PDF editing tools to help businesses and individuals work more efficiently. The software works with PDFs to host electronic signatures and encrypt documents, store PDF projects to UPDF Cloud that employees annotate or add to the document no matter where they end up working that day, at home, or on the beach.
Windows • macOS • iOS • Android 100% secure

One of the key ways that UPDF helps improve productivity is by streamlining document management.
- Users can easily edit PDF documents and share them within the platform, eliminating the need for multiple versions and ensuring that everyone is working from the same information.
- The platform also includes electronic signature functionality, allowing users to sign and send documents electronically, saving time and reducing the need for printing and scanning.
- This is the collaboration piece that allows teams of people to easily collaborate on a project with powerful annotation tools. The team just signed up with UPDF to begin working on a project!
FAQs on Choosing the Best Gantt Chart Tool
Is Google Gantt chart free?
Yes, the Google Gantt chart is free.
Where can I create a Gantt chart for free?
Gantt charts could be generated for free in a Google document!
How do you create a Gantt chart in Excel?
- Create a list of tasks in Excel: add a start and end date for each task
- Create a bar chart: Go to the insert tab and select the Bar chart option. Choose a stacked bar chart with the dates on the X-axis.
- Add task data: Add your task data to the chart by clicking on the chart and selecting the Select Data option. Add a series for each task, with the name of the task as the series name, the start date as the X-axis value, and the duration of the task as the Y-axis value.
- Format the chart: Format the chart to make it more visually appealing and informative. Add labels for each task, change the colors of the bars to make them more distinct, and adjust the font sizes and styles as needed.
- Add milestones: To do this, go to the insert tab and select the Shape option. Choose a vertical line and place it on the chart at the appropriate date.
- Customize the chart: add a legend, adjust the scale of the X and Y axes, and add other formatting options to make the chart more useful and informative.
Which tool is best for the Gantt chart?
There are many ways to create a Gantt chart! The best way to create a Gantt chart is through Google Sheets. Inputting data within the sheet makes it easy for the Gantt chart to be created once everything is labeled correctly and then go to the template gallery to choose a chart to view the data!
Conclusion
Gantt charts are an essential project management tool that helps teams to manage their tasks effectively. They provide a visual representation of project timelines, task dependencies, and progress, which makes it easier to track project performance. With the availability of Gantt chart software and templates, team members can create Gantt charts quickly and easily. The use of Gantt charts can help teams to avoid delays, improve communication and meet project deadlines.
As a project manager, you also need to deal with a lot of PDF documents, and that's why we introduce UPDF in this article too. To improve your productivity, this tool helps you to read, edit, annotate, organize, and OCR PDFs easily. Download it now.
Windows • macOS • iOS • Android 100% secure


 Enola Davis

 Enid Brown