 UPDF for Windows
 UPDF for Mac
 UPDF for iPhone/iPad
 UPDF for Android
 Nomostar
 UPDF AI Online
 UPDF Sign
 IvyCraft
 Edit PDF
 Annotate PDF
 Create PDF
 PDF Form
 Edit links
 Convert PDF
 OCR
OCR PDF to Word
 PDF to Image
 PDF to Excel
 Organize PDF
 Merge PDF
 Split PDF
 Crop PDF
 Rotate PDF
 Protect PDF
 Sign PDF
 Redact PDF
 Sanitize PDF
 Remove Security
 Read PDF
 UPDF Cloud
 Compress PDF
 Print PDF
 Batch Process
 About UPDF AI
 UPDF AI Solutions
 AI User Guide
 FAQ about UPDF AI
 Summarize PDF
 Translate PDF
 Chat with PDF
 Chat with AI
 Chat with image
 PDF to Mind Map
 Explain PDF
 PDF AI Tools
 Image AI Tools
 AI Chat Tools
 AI Writing Tools
 AI Study Tools
 AI Working Tools
 Other AI Tools
 AI Bookmark Generation
 AI Bookmark Summary
 AI Watermark Generation
 AI Background Generation
 AI Sticker Generation
 AI Stamp Generation
 AI Editing Suite
 UPDF Copilot
 AI Page Management
 AI Semantic Search
 PDF to Word
 PDF to Excel
 PDF to PowerPoint
 User Guide
 UPDF Tricks
 FAQs
FAQs UPDF Reviews
 Download Center
 Blog
Blog Newsroom
 Tech Spec
 Updates
 UPDF vs. Adobe Acrobat
 UPDF vs. Foxit
 UPDF vs. PDF Expert
Introduction
If you’re someone who deals with numbers in school, university, business reports, or PDF-based data files, you’ve definitely come across the term Standard Deviation. However, many people believe it is only a statistical formula used in research papers or advanced data science. Actually, standard deviation is an essential tool that can summarize and provide easy interpretation of data, whether you realize it or not.
And calculating it becomes incredibly easy when you know how to do it inside Excel.
Moreover, I’ll show you how to find standard deviation step-by-step in Excel, with built-in formulae and how you can do it manually to understand the workflow of calculations, and then how UPDF AI can help you understand standard deviations because it is going to be an app that wont ask you any third party, just UPDF and its powerful features for students. You can click the button below to download it and have a try.
Windows • macOS • iOS • Android 100% secure
Part 1. What is Standard Deviation in Simple Words?
Standard deviation is a measurement that tells you how much variation is inside a dataset. Let's say I have cricket scores of 20 players, and everyone scored around the same, then the standard deviation is small. But if some scored 10 while others scored 95, then the variation is big, and the standard deviation is high.
So, from this explanation and the values of standard deviation, we can tell how consistent a batsman or a footballer is. Well, below are some of the real-world examples other than sports:
- Businesses use it to detect stability or volatility (like monthly sales swings).
- Crypto traders check deviation to evaluate price volatility.
- Data analysts use it for risk + performance comparison.
- Teachers use it to understand classroom performance.
Standard deviation shows how spread out or how consistent your values are.
Low Standard Deviation = numbers are consistent.
High Standard Deviation = numbers jump a lot.
One simple sentence that allows me to never forget this concept is: “how far my values are above or below from the mean in the data.”
Real Example Related to PDF
Most people today receive reports, survey feedback, invoices, and financial summaries as PDF files. When you extract numerical data from PDFs and paste them into Excel, the first thing most analysts check is the standard deviation to understand volatility.
For example:
You export weekly PDF sales data from UPDF → paste into Excel → calculate standard deviation → instantly know whether your business is stable or risky.
Part 2. Functions to Standard Deviation in Excel
When working with data in Excel for calculations or statistical analysis, it is essential to understand the difference between STDEV.S and STDEV.P. Both formulas have a slight change but a major difference in their interpretation. Mainly, the concept is about “how spread” there is in the data. However, they differ in the type of dataset they are designed for, and using the wrong one can distort your results.
Key Differences Between STDEV.S and STDEV.P:
- STDEV.S (Sample Standard Deviation): Used when your dataset represents only a sample of the entire population. Sample data is mainly used to make inferences for the larger population. Excel uses this formula to estimate the variations in a subset of a large dataset, divided by (n-1), where n is the total number of data points and n-1 is the correction factor.
- STDEV.P (Population Standard Deviation): When you have data for the entire population, the STDEV.P function is applied. This formula divides the total variation by N (the total number of data points) because the data already represents everyone.
Examples:
- STDEV.S: Imagine measuring the exam scores of 50 students from a university of 5,000. Since these 50 represent just a portion of the total, you’d use STDEV.S to estimate how scores vary across the whole university.
- STDEV.P: If you collected the exam scores of all 5,000 students, you’d use STDEV.P, because the data already includes every member of the population.
Part 3. How to Calculate Standard Deviation in Excel?
We have now reached the main stage of calculating the values of standard deviations, having studied the importance of this measurement. Whether you have test scores or sales volume, the STDEV functions work as long as the data is numerical. We will also provide a manual method, but Excel makes this calculation easy with built-in functions like STDEV.S and STDEV.P. Additionally, you can compute it manually to understand the logic behind it.
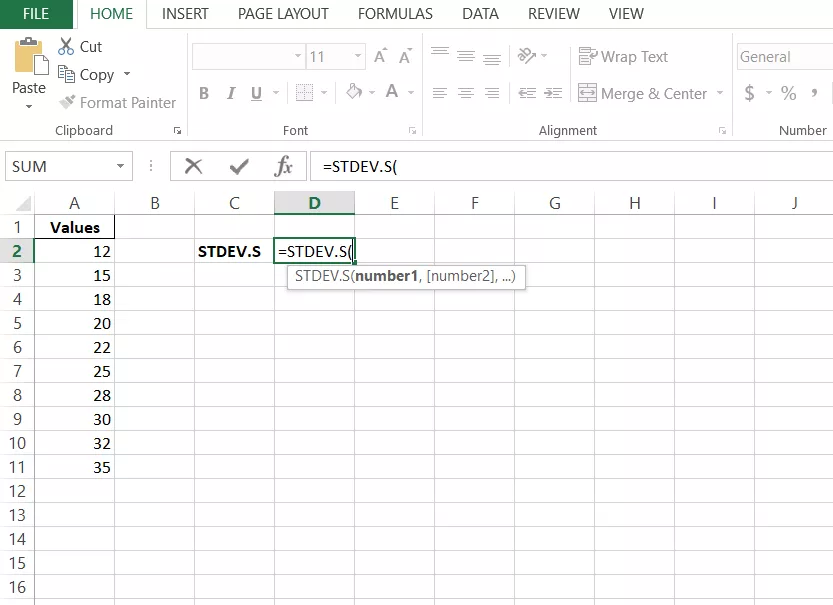
1. Using STDEV.S (Sample Standard Deviation):
This function is used when your dataset represents a sample of a larger population. The formula is:
=STDEV.S(number1:number2)
Here, Excel calculates how much your sample data varies from the mean by dividing by (n – 1), where n is the number of observations.
Example: If you’re analyzing the heights of 10 students out of 100 in a class, use STDEV.S because your data is just a sample.
2. Using STDEV.P (Population Standard Deviation):
This function is for when you have data for the entire population. The formula is:
=STDEV.P(number1:number2)
It divides by n instead of (n – 1) since there’s no need to estimate because you already have all the data points.
Example: If you record the heights of all 100 students in the class, use STDEV.P.
Part 4. Bonus Tip: Understanding Standard Deviation via UPDF AI
The main point that many users are missing is the explanation and step-by-step procedure for the entire formula. The functions discussed above are excellent at calculating results but lack clarity in showing the workflow of the process. Users must be able to learn the backend concept of how the dataset generates a single value of standard deviation. Here, the UPDF gets a greater advantage.
Instead of juggling multiple apps (one to open documents, another to query AI, and a third to edit results), use UPDF: it combines PDF viewing, AI explainers, image chat, OCR, and conversion tools in one place so you can go from raw report → highlight → extract numbers → ask “why” — all without switching apps.
Windows • macOS • iOS • Android 100% secure

Understanding variance using UPDF AI — Desktop
- Open UPDF Desktop and upload your report or scanned PDF (or drag the file in).
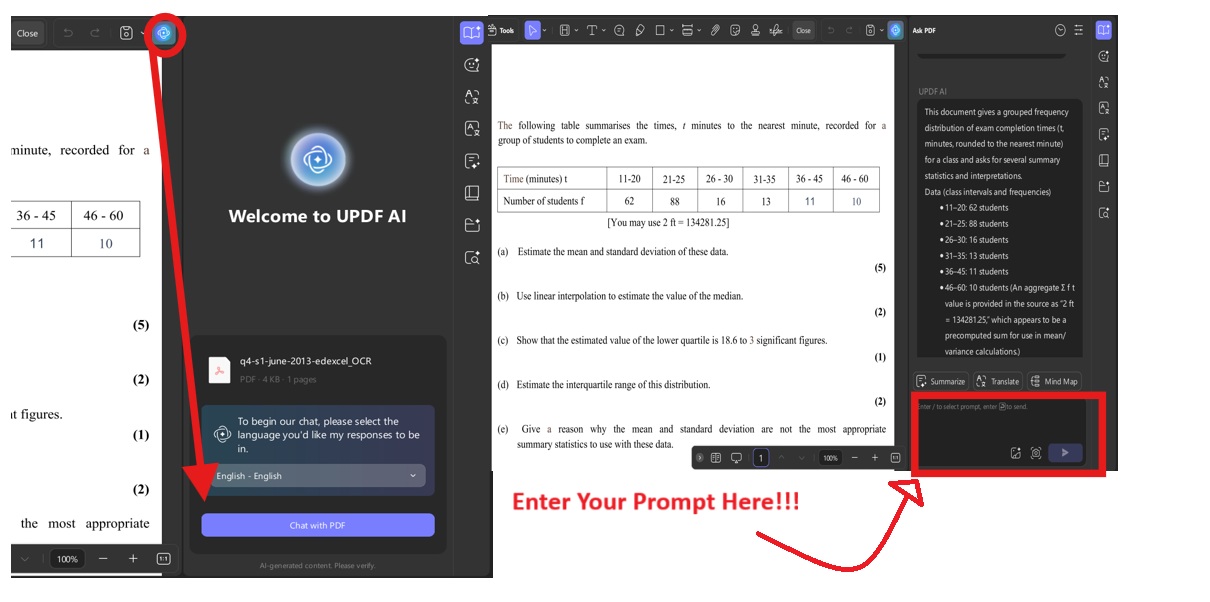
- Click the UPDF AI (CTRL + E) > then click Ask PDF.
- Use the "Screenshot" icon in the dialogue box below UPDF AI to take a screenshot of the part of the document you have questions about and ask UPDF AI. Then, enter prompts in the UPDF AI dialogue box. For example: “Explain how the variance in this dataset helps us understand a student’s performance.”
- Save the AI explanations as notes or insert the generated mind map into the PDF for later review. These desktop AI feature lets you generate answers or a complete workflow, which you can save for every question.
Understanding variance using UPDF AI — Online
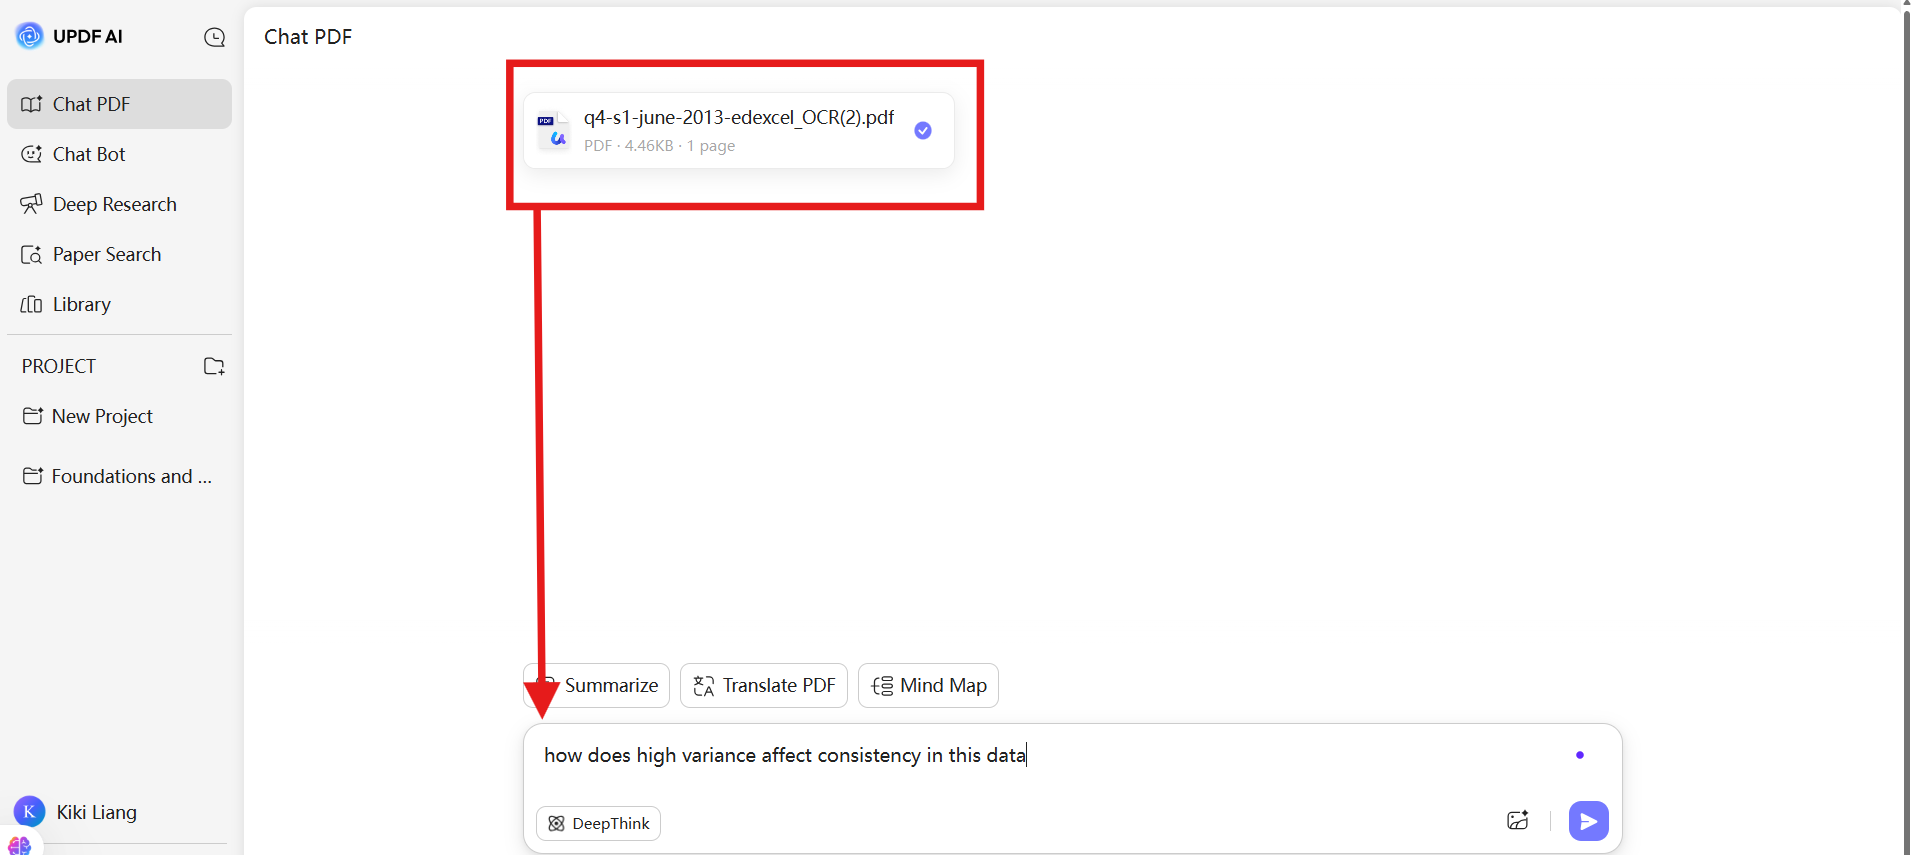
If you don't want to download the software, use UPDF AI Online: open the UPDF AI Online, upload your PDF or screenshot, and ask the same step-by-step questions. It’s fast and you can download the document of answers later. (Simple steps: open https://ai.updf.com/chat-pdf/ or click the button below → Upload PDF/image → Ask “how does high variance affect consistency in this data”.
Understanding variance using UPDF AI — Mobile
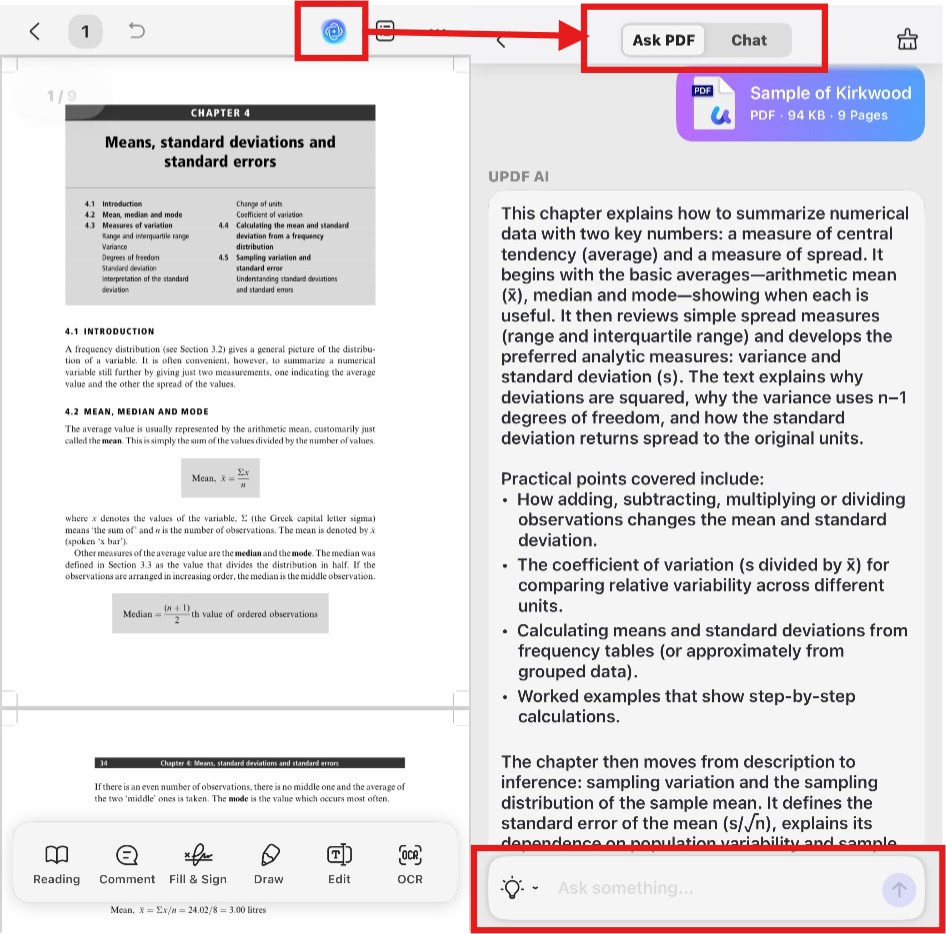
On mobile (iOS/Android), open the UPDF app, Click the “+” icon on the homepage to import your files to UPDF > then click on the UPDF AI icon on the top right. The chat feature can also help you explain concepts, translate text, summarize content, and ask questions easily.
Windows • macOS • iOS • Android 100% secure
Related UPDF features
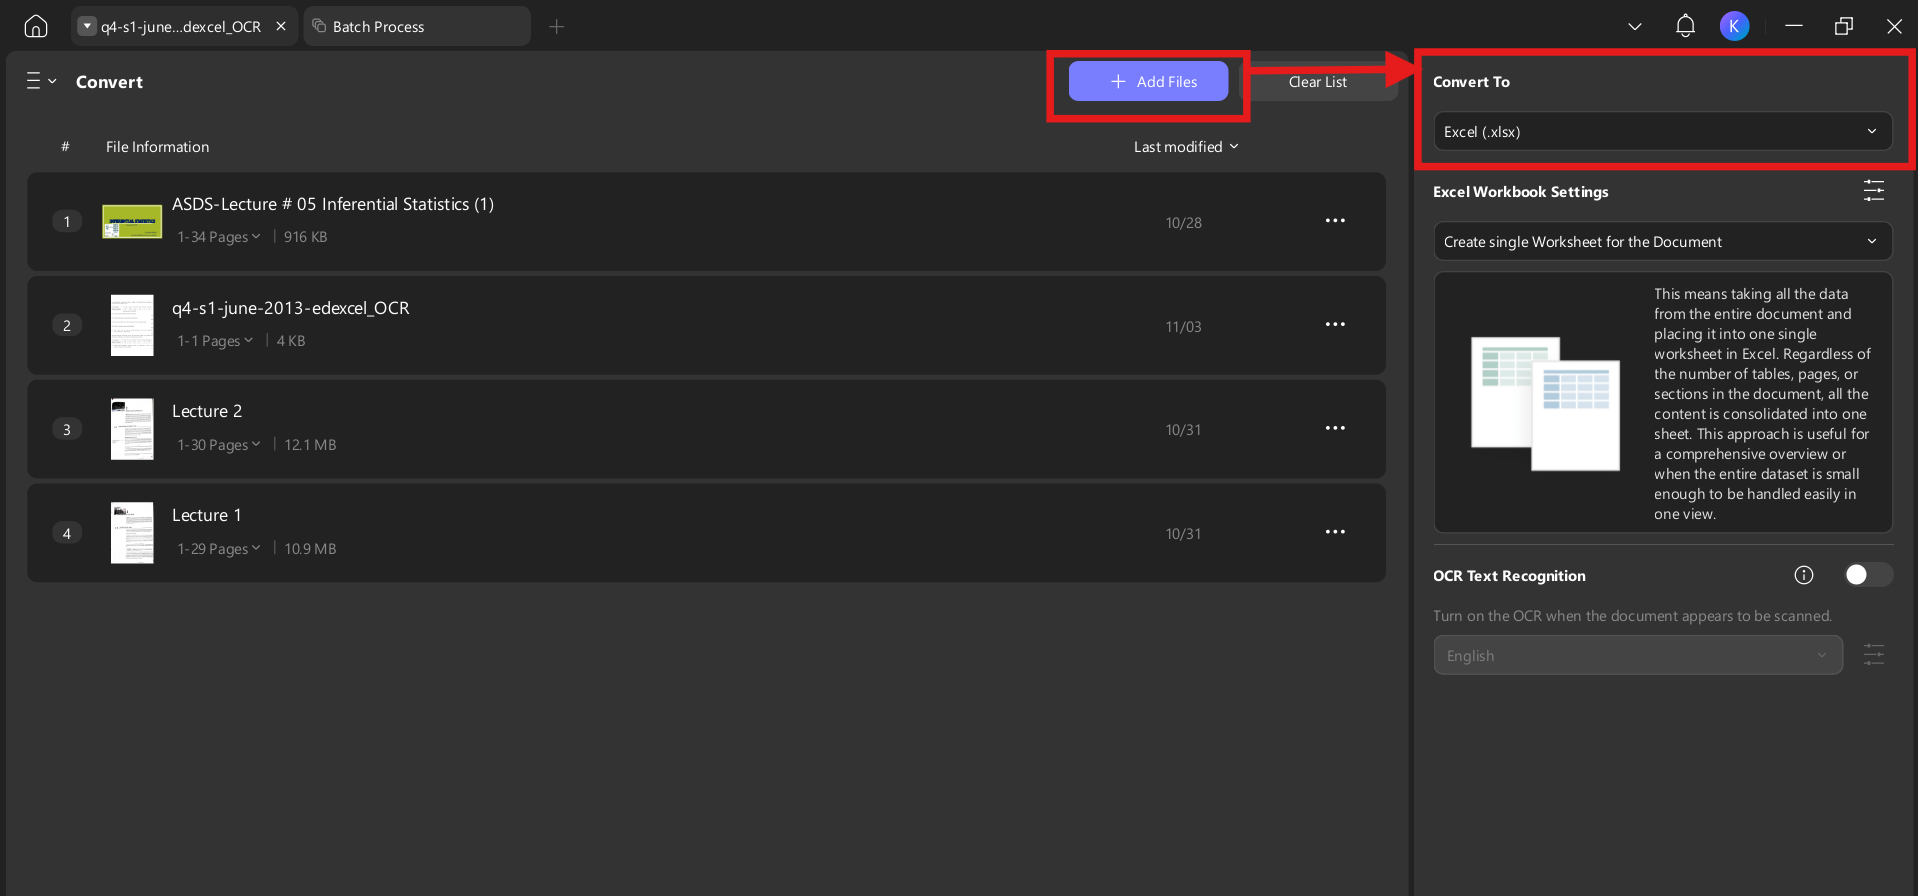
- Convert PDF to Excel: Since PDF data is static and locked, it can’t be sorted or analyzed easily. Converting it to Excel allows you to apply formulas, draw charts, and prepare the data for deeper analysis.
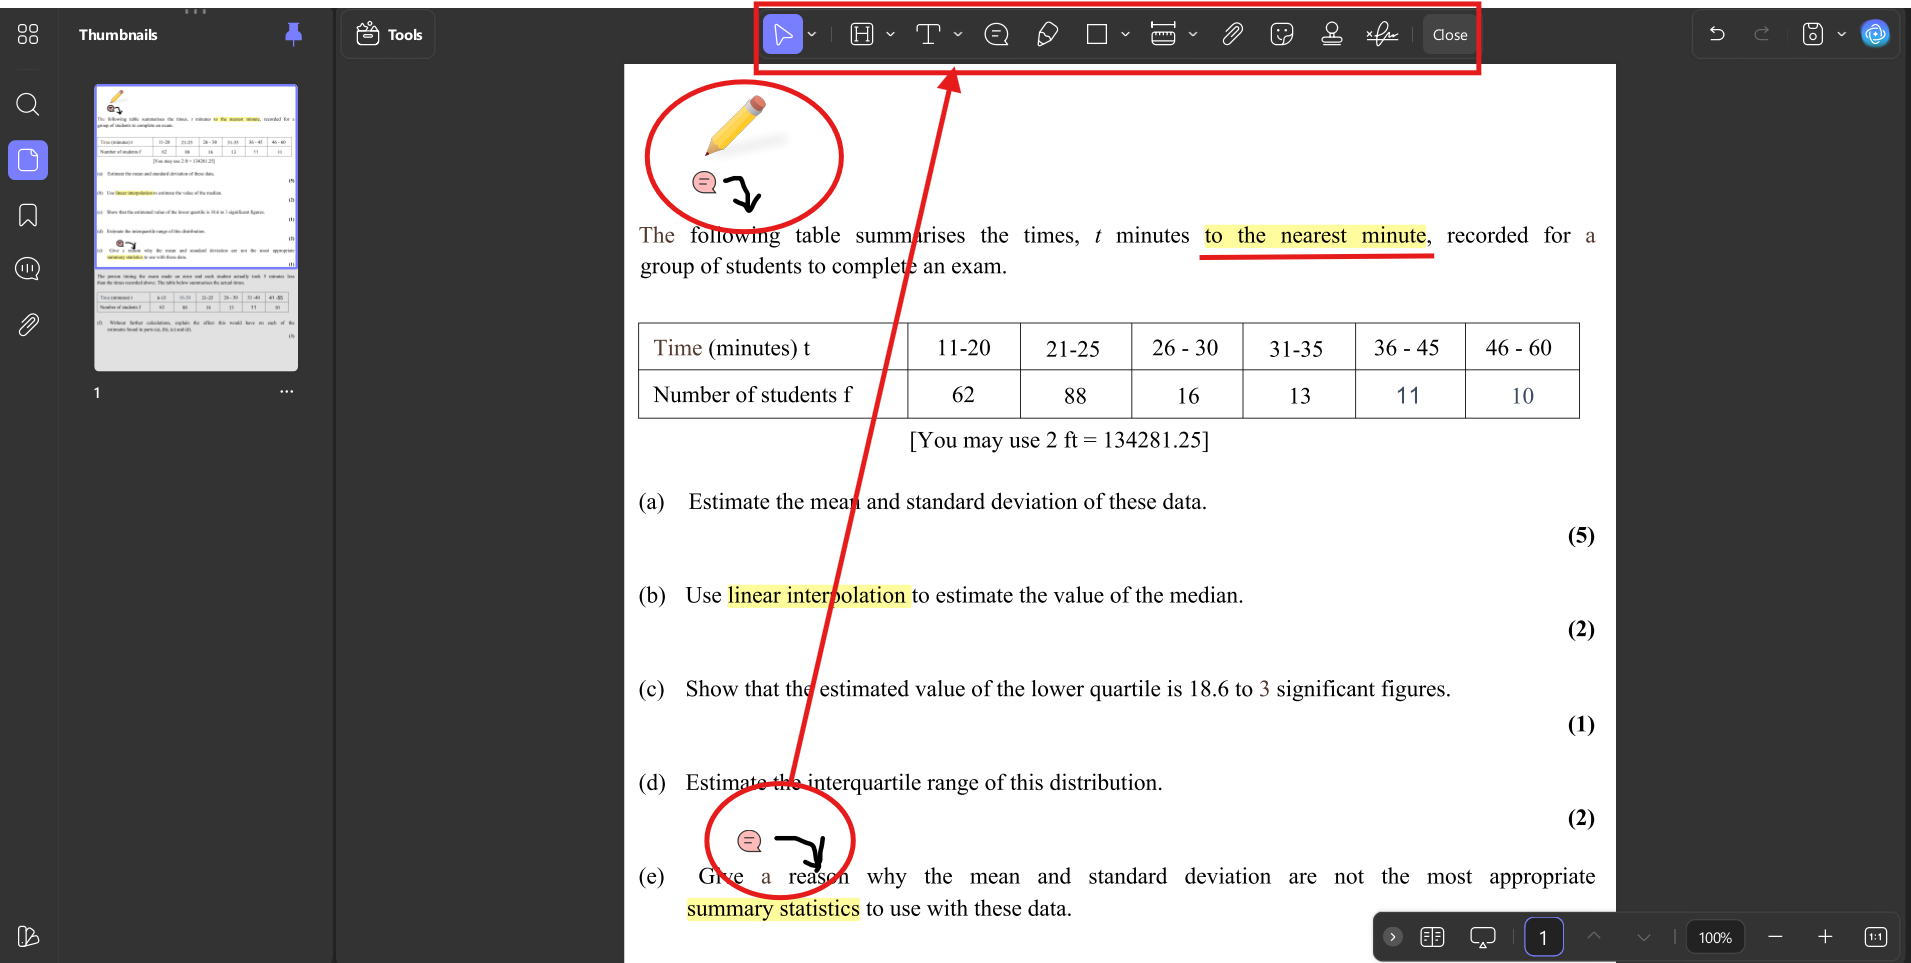
- Annotate reports: I love the annotating feature, as I enjoy making notes, and an annotating tool like UPDF is fantastic due to its excellent compatibility with PDF documents. I even use UPDF for my study material. For example, you can highlight key rows, add sticky notes explaining why you chose STDEV.S vs STDEV.P, or mark assumptions in the dataset so you don’t lose context when reviewing later.
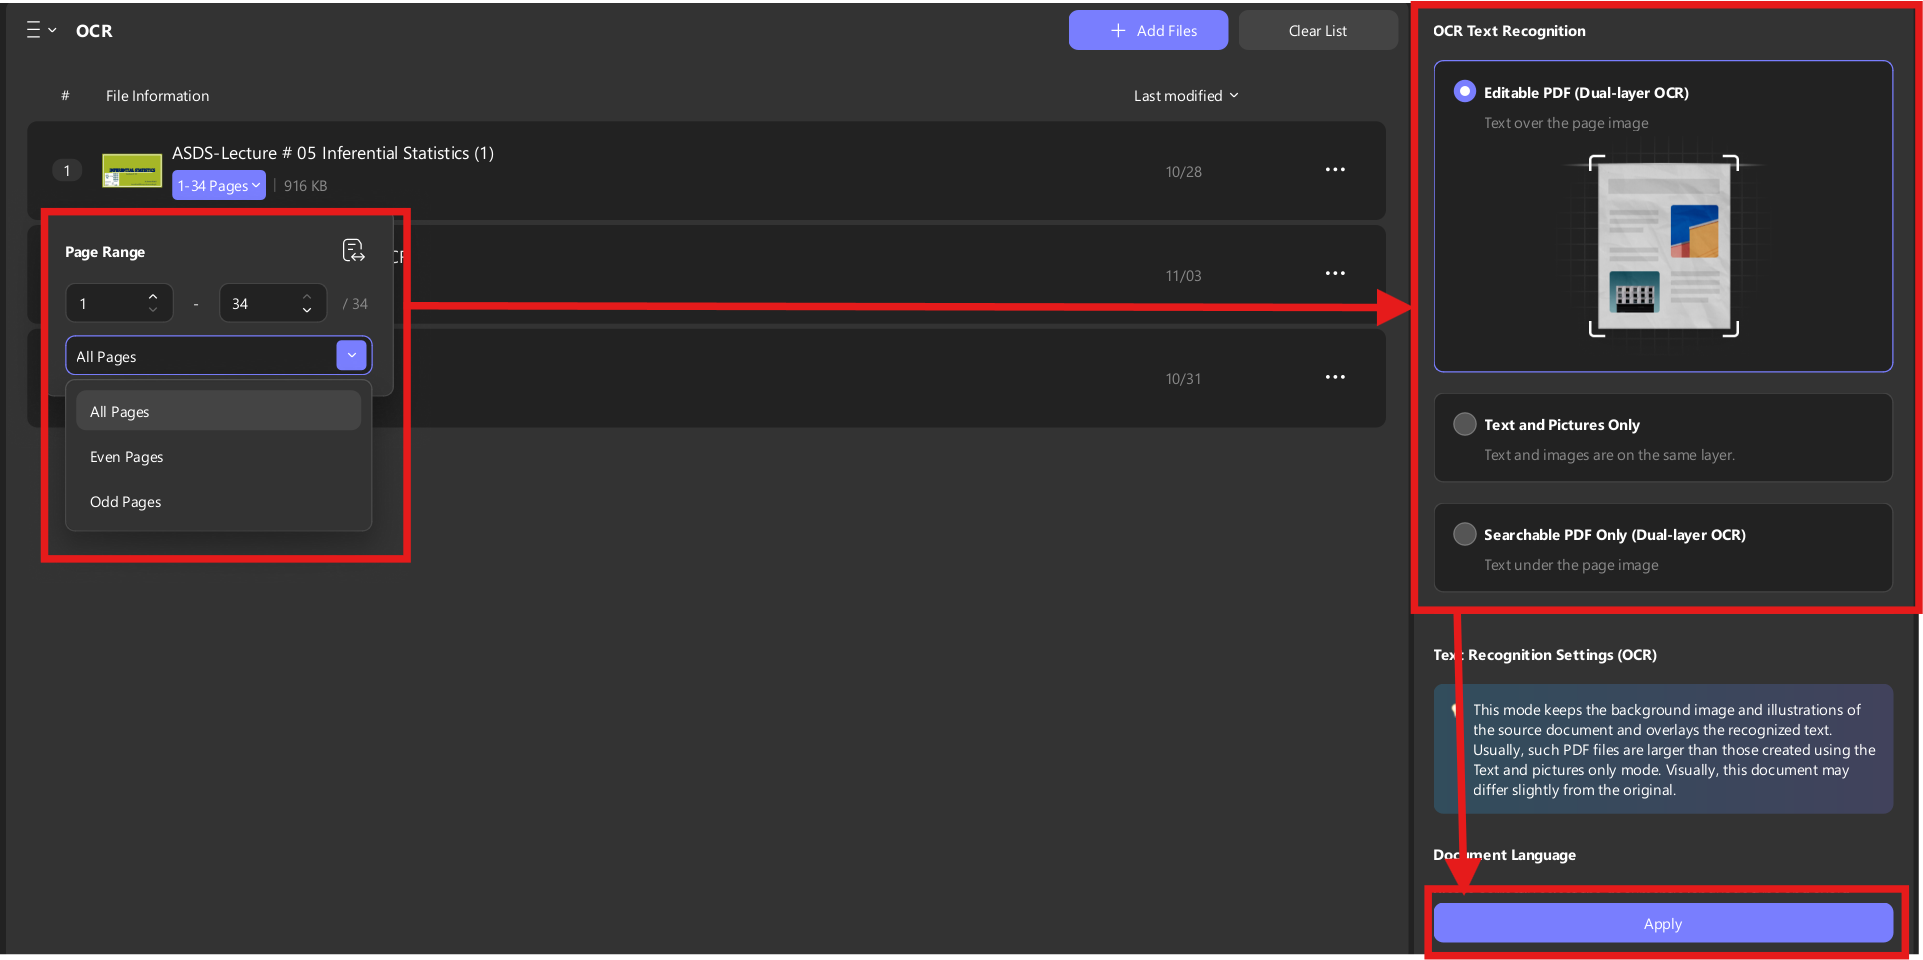
- OCR to extract numbers into Excel: The idea is that UPDF’s OCR reads all the text and images in any language, thereby enabling the ability to extract them. Later, you can convert scanned tables and invoices into editable Excel columns (supporting 38+ languages, with batch OCR available). Once numbers are in Excel, you can compute variance and standard deviation directly. OCR removes manual retyping errors that can ruin your statistics.
Conclusion
All in all, we have seen how to calculate standard deviation in Excel and also the difference between STDEV.S and STDEV.P in Excel. Moreover, users often face issues with handling multiple software applications, which is why we came up with UPDF. It is an all-in-one solution that features its own AI chat, PDF reader, file converter, and many more capabilities. UPDF is a highly compatible and time-saving companion for your daily work.
Windows • macOS • iOS • Android 100% secure


 Engelbert White
 Enid Brown