UPDF for Windows
 UPDF for Mac
 UPDF for iPhone/iPad
 UPDF for Android
 Nomostar
 UPDF AI Online
 UPDF Sign
 IvyCraft
 Edit PDF
 Annotate PDF
 Create PDF
 PDF Form
 Edit links
 Convert PDF
 OCR
OCR PDF to Word
 PDF to Image
 PDF to Excel
 Organize PDF
 Merge PDF
 Split PDF
 Crop PDF
 Rotate PDF
 Protect PDF
 Sign PDF
 Redact PDF
 Sanitize PDF
 Remove Security
 Read PDF
 UPDF Cloud
 Compress PDF
 Print PDF
 Batch Process
 About UPDF AI
 UPDF AI Solutions
 AI User Guide
 FAQ about UPDF AI
 Summarize PDF
 Translate PDF
 Chat with PDF
 Chat with AI
 Chat with image
 PDF to Mind Map
 Explain PDF
 PDF AI Tools
 Image AI Tools
 AI Chat Tools
 AI Writing Tools
 AI Study Tools
 AI Working Tools
 Other AI Tools
 AI Bookmark Generation
 AI Bookmark Summary
 AI Watermark Generation
 AI Background Generation
 AI Sticker Generation
 AI Stamp Generation
 AI Editing Suite
 UPDF Copilot
 AI Page Management
 AI Semantic Search
 PDF to Word
 PDF to Excel
 PDF to PowerPoint
 User Guide
 UPDF Tricks
 FAQs
FAQs UPDF Reviews
 Download Center
 Blog
Blog Newsroom
 Tech Spec
 Updates
 UPDF vs. Adobe Acrobat
 UPDF vs. Foxit
 UPDF vs. PDF Expert
As an Excel user, I know how time-consuming it can be to create charts, tables, and summaries manually. That's why I love Excel’s Quick Analysis tool, a feature that lets you easily access various data analysis options for a selected range.
In this article, I’ll explain what this tool does and how to use it on both Windows and Mac. We’ll also explore why it might not be visible in your version of Excel, and how to fix that.
Plus, once we’ve analyzed the data, you can use UPDF to convert your spreadsheet into a professional PDF report. Read on to learn all the steps and see how UPDF helps share your findings!
Windows • macOS • iOS • Android 100% secure
Part 1. What Is the Quick Analysis Tool in Excel?
The Quick Analysis tool, introduced in Excel 2013, is a convenient pop-up menu that appears when you select a range of data. It provides instant actions like converting data to charts, summary tables, or sparklines, without navigating the menu.
In simple terms, Quick Analysis is a tool to transform raw data into clear and concise visual representations. This means with just a few clicks, you can apply conditional formatting, insert formulas, or create a chart.
Part 2. How to Quickly Analyze Data in Excel
The Quick Analysis tool is quite simple to use. You can use the following steps on Windows:
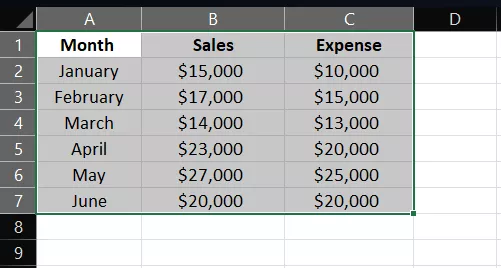
Step 1. First, click and drag to highlight the cells you want to analyze.
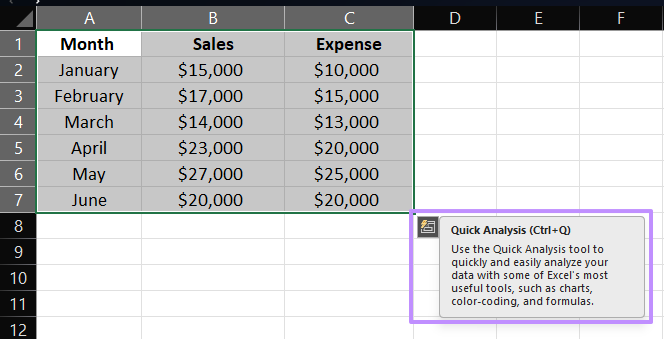
Step 2. Look for the lightning-bolt icon at the bottom right of the selection. This small icon is the Quick Analysis button. If you don’t see it, press “Ctrl+Q” to invoke the menu.
Step 3. The Quick Analysis menu displays five tabs of options. Hover over each tab to preview the change, then click to apply it.
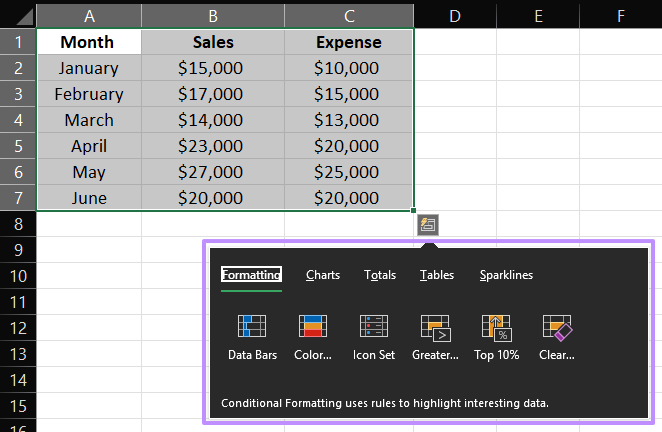
Once open, the menu offers five categories of tools:
- Formatting: Quickly apply conditional formatting rules to visualize data. For example, add color scales, data bars, or icon sets to highlight top values, duplicates, or specific conditions. This can instantly reveal trends or outliers without manually setting up rules.
- Charts: Auto-suggests chart types (column, line, pie, etc.) based on your data. When you hover over a chart icon, Excel previews how it would look. Clicking inserts the chart onto the sheet.
- Totals: Inserts summary formulas like Sum, Average, Count, % of Total, or Running Total. For example, you can select a sales table and click “% Total” to instantly see each value’s share of the column or row total. It effectively creates quick subtotal rows or columns for you.
- Tables / PivotTables: Converts the range into an official Excel Table (with filter/sort controls) or creates a new PivotTable. You can use this to format raw lists: clicking “Table” wraps the data in a styled table. The “PivotTable” option immediately opens a new PivotTable in a separate sheet which saves a few clicks if you need deeper analysis.
- Sparklines: Adds mini in-cell charts (Line, Column, or Win/Loss) beside each row of data. These sparklines visually represent trends for each row without taking much space. For instance, showing monthly sales trends next to each product.
Each category is accessible via keyboard: after “Ctrl+Q,” press “F” for Formatting, “C” for Charts, “O” for Totals, “T” for Tables, or “S” for Sparklines.
Part 3. Why Don’t You Have the Quick Analysis Tool in Excel?
Many users think the Excel Quick Analysis tool is missing, but in reality, it’s just turned off or hidden by default. We can usually fix it.
For Windows
If you don’t see the Quick Analysis icon when you select the data, you need to enable it by following these steps.
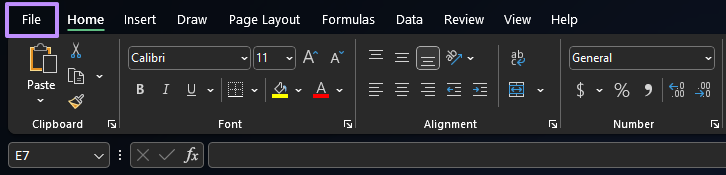
Step 1. Begin the process by clicking the “File” tab on the top left side of the Excel ribbon.
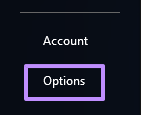
Step 2. Now, go for “Options” located at the bottom of the left panel.
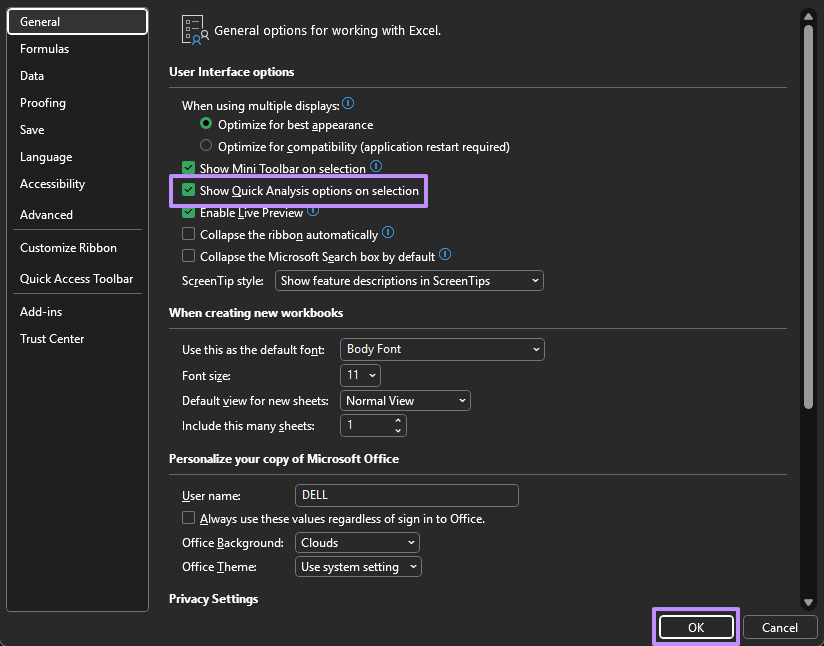
Step 3. A separate options window will pop up. You need to navigate to the “General” section and check the “Show Quick Analysis options on selection” box. Then, select “Ok” to save it.
For Mac
In newer Microsoft 365 versions for Mac, the Quick Analysis button has been replaced by the “Ideas” button. This feature serves a similar purpose to Excel in Windows: it analyzes your selected data and suggests charts, trends, and summaries automatically.
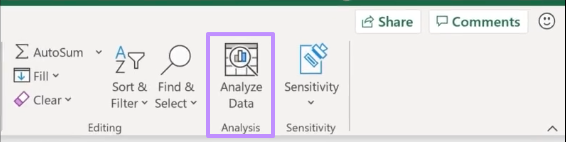
However, not all Mac versions include the Ideas button. According to a Microsoft Answers discussion, the term “Ideas” has been used loosely over the years, and in the most recent Excel builds, it’s been replaced again by the “Analyze Data” button on the Home tab of the ribbon.
That said, all the essential features of the Quick Analysis tool still exist in Excel for Mac. They’re just located in different areas of the interface:
- Formatting: Right-click your selection and choose “Format” to adjust cell styles.
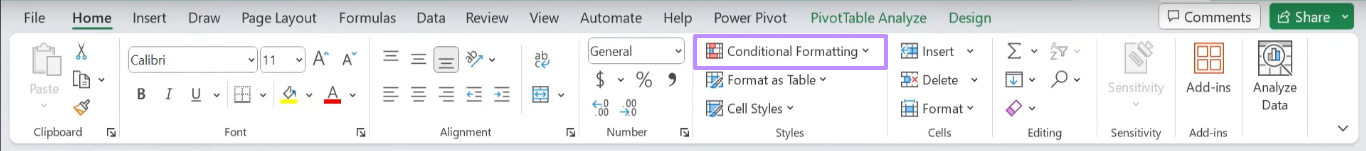
- Conditional Formatting: Go to the “Home” tab; you’ll find it near the middle of the ribbon.
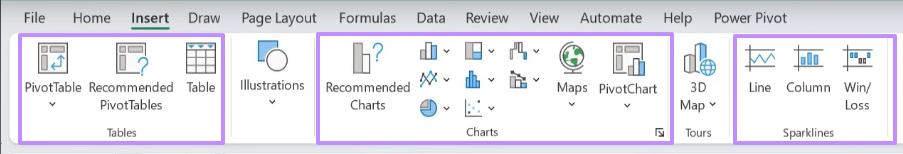
- Charts: Open the “Insert” tab and select the desired chart type.
- Totals: Use Excel’s “Table” feature from the “Insert” tab. Totals appear in the ribbon when your selection is within a table.
- Sparklines: Go to the “Insert” tab and click the “Sparklines” button to add trend visuals inside cells.
So, while Mac doesn’t show the same pop-up Quick Analysis icon that Windows users see, you still have every core capability.
Part 4. Turn Your Spreadsheet into a Polished PDF Report with UPDF
Now that we’ve analyzed our data in Excel, the next step might be creating a report to share. I often convert my Excel sheet to a PDF to preserve formatting and share easily. This is where UPDF comes in handy. UPDF is a powerful PDF editor that lets me convert and edit the report right away.
Windows • macOS • iOS • Android 100% secure
Key Features
- Convert Excel to PDF (and back): UPDF allows you to open or import the Excel file and save it as a PDF. It even supports batch conversion to convert multiple spreadsheets at once. Conversely, if you have a PDF report to update, UPDF can convert it back into an Excel or Word file for easy editing.
- Edit and Format: UPDF provides full control to edit text, images, and layout in the PDF just like in a text editor. If you need to tweak headings or update figures from the analysis, it’s easy to do directly on the PDF.
- Annotate and Highlight: To emphasize key insights, you can add highlights, comments, or annotations on the report.
- Organize Pages: UPDF includes tools to merge multiple documents, split sections, or reorder pages. If a report needs cover pages or an appendix, the tool can assemble them all into one final PDF.
- Security and Sharing: Before sharing, the platform allows users to password-protect the PDF or add permissions so others can’t accidentally change it. Also, watermarks or stamps can be added if needed. When the report is ready, you can share a link or QR code directly from UPDF.
Steps to Create a PDF Report Using UPDF
You can follow these steps to create a PDF report from the Excel document.
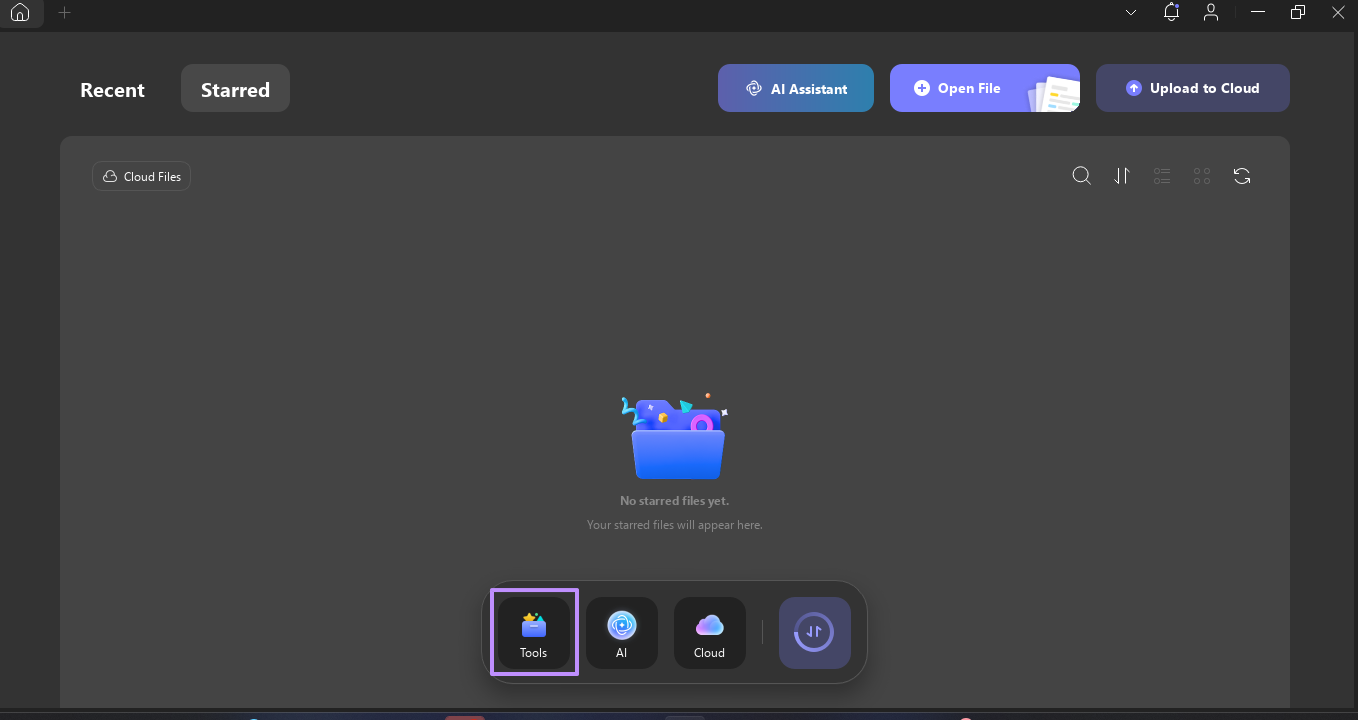
Step 1. First, download and install UPDF on your system. Then launch it and head towards the “Tools” menu.
Windows • macOS • iOS • Android 100% secure
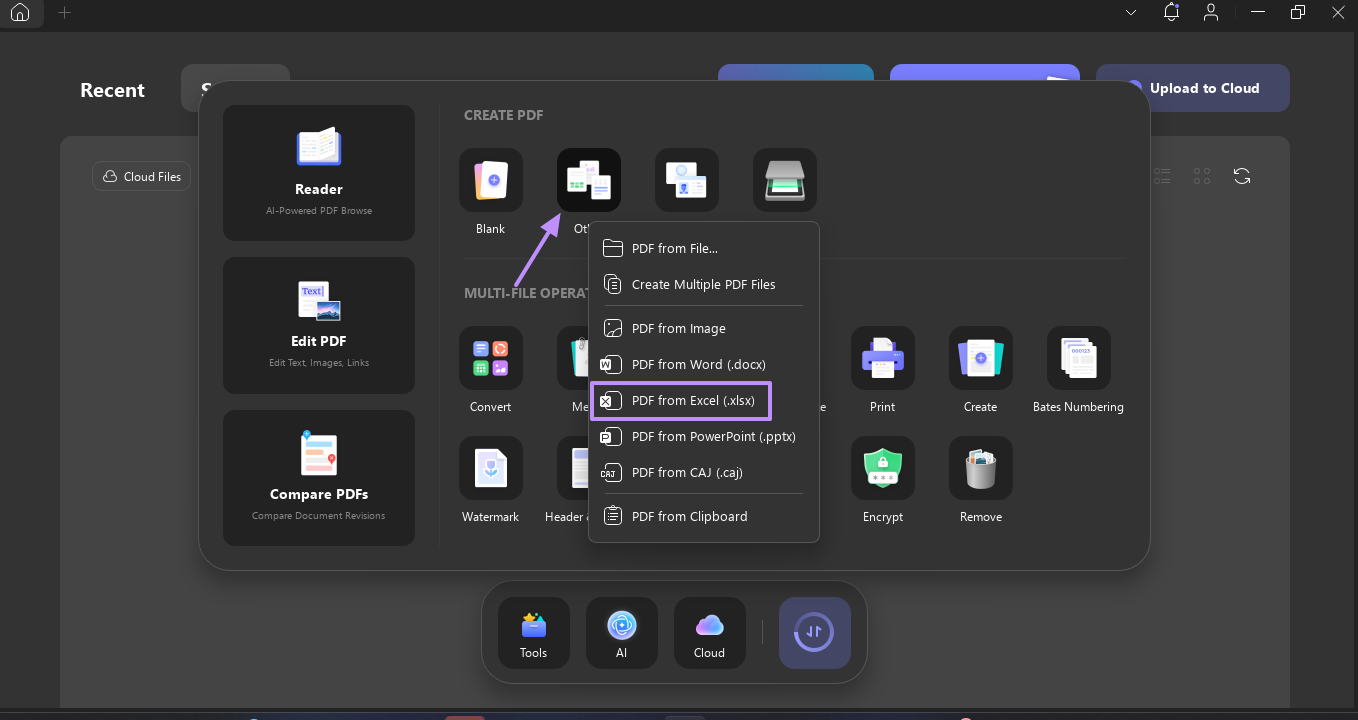
Step 2. Now, select the “Others” option and choose “PDF from Excel (.xlsx).”
Alt text: opting for the other option and selecting pdf from excel
Step 3. Then hit on the “Select files” button and choose the file from your system you want to convert.
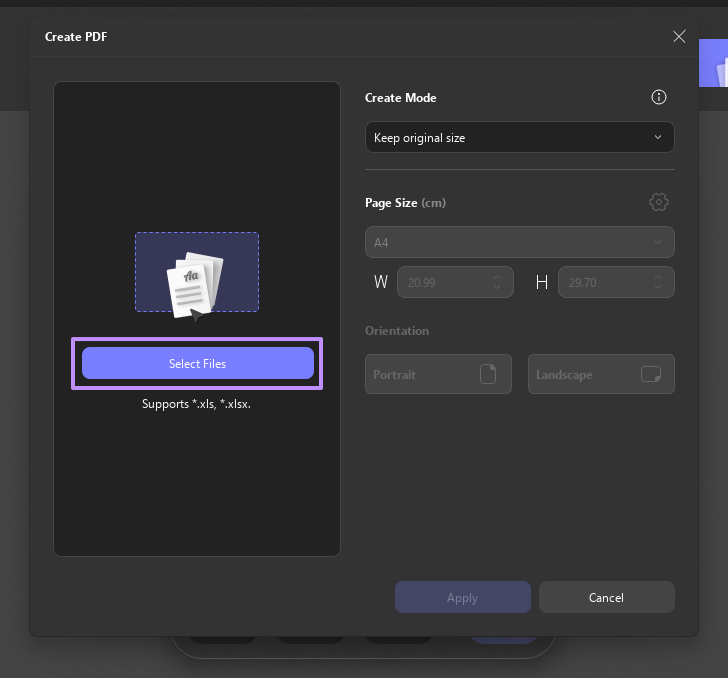
Next, UPDF will automatically convert the Excel file to PDF. You can then use the key features mentioned above to edit your PDF report — it's very simple to use!
Windows • macOS • iOS • Android 100% secure
Conclusion
Quick Analysis tool Excel is a game-changer for rapid data summarization. You can quickly turn numbers into insights with charts, totals, or tables without manual formulas. If you ever don’t see it, remember to enable it in “Options” or use the Mac alternative.
After doing a quick analysis, we often need to share the document. This is when UPDF shines, which allows you to convert your spreadsheet to PDF, edit text, highlight key results, and secure it; all in one place. I highly recommend trying UPDF for your next Excel report; it complements Excel by making your final PDF report look professional.
Windows • macOS • iOS • Android 100% secure


 Enid Brown