 UPDF for Windows
 UPDF for Mac
 UPDF for iPhone/iPad
 UPDF for Android
 UPDF AI Online
 UPDF Sign
 Edit PDF
 Annotate PDF
 Create PDF
 PDF Form
 Edit links
 Convert PDF
 OCR
OCR PDF to Word
 PDF to Image
 PDF to Excel
 Organize PDF
 Merge PDF
 Split PDF
 Crop PDF
 Rotate PDF
 Protect PDF
 Sign PDF
 Redact PDF
 Sanitize PDF
 Remove Security
 Read PDF
 UPDF Cloud
 Compress PDF
 Print PDF
 Batch Process
 About UPDF AI
 UPDF AI Solutions
 AI User Guide
 FAQ about UPDF AI
 Summarize PDF
 Translate PDF
 Chat with PDF
 Chat with AI
 Chat with image
 PDF to Mind Map
 Explain PDF
 PDF AI Tools
 Image AI Tools
 AI Chat Tools
 AI Writing Tools
 AI Study Tools
 AI Working Tools
 Other AI Tools
 PDF to Word
 PDF to Excel
 PDF to PowerPoint
 User Guide
 UPDF Tricks
 FAQs
FAQs UPDF Reviews
 Download Center
 Blog
Blog Newsroom
 Tech Spec
 Updates
 UPDF vs. Adobe Acrobat
 UPDF vs. Foxit
 UPDF vs. PDF Expert
Variance is a crucial aspect of data analysis, as it helps determine the extent to which individual values deviate from the average. It is one of the skills worth mastering, as it is widely used in business, finance, and research to evaluate consistency and risk.
We will use this guide to walk you through the effective techniques on how to calculate variance in Excel, enabling you to manage your data with confidence. Continue reading to the end of this article to discover how UPDF AI helps you understand the variance calculations.
Windows • macOS • iOS • Android 100% secure
Part 1. What is Variance?
Variance is a statistical instrument, which explains the level of deviation of the individual values of data, as compared to the total mean. Learning how to calculate variance in Excel can help you determine the spread of data, allowing analysts to determine whether the values are clustered or dispersed. Higher variance implies more variability and vice versa, hence it is a very important concept in the proper interpretation of data.
The Importance of Calculating Variance Data
- Data Analysis: Variance provides a clear picture of how the data points differ from the mean, making it easier to interpret patterns and overall distribution.
- Risk Assessment: Many businesses use variance to determine the degree of uncertainty or volatility in financial returns, enabling them to make informed investment decisions.
- Quality Control: It helps manufacturers check the consistency of production processes and identify irregularities or errors promptly.
- Forecasting Accuracy: Knowing how to find variance in Excel helps professionals to refine forecasting models and make more accurate predictions in fields such as finance and sales.
- Strategic Decision Making: Variance provides managers with a deeper understanding of performance trends, enabling them to make informed, evidence-based, and strategic business decisions.
- Performance Evaluation: Organizations also use variance to measure consistency in employee productivity or system performance, ensuring that goals are achieved efficiently.
Part 2. Different Functions to Calculate Variance in Excel
Before you jump into understanding how to calculate variance in Excel, you must be aware of the different functions available. In this section, we will be looking into the different functions you can apply in Excel to calculate variance based on your query:
1. VAR.S Function in Excel
The VAR.S is a calculated variance that uses a sample of information as opposed to the whole population. It is commonly applied to statistics where it is used to estimate the distribution of data points around the mean by analyzing a subset of the values.
Note.
2. VAR.P Function in Excel
VAR.P is a method used to compute the variance in complete population data. It is a function to use when all the values are available, as it provides accurate information about the distribution of data in general without relying on estimations.
Note.
3. VARA Function in Excel
The VARA function is similar to VAR.S, except that it also calculates text and logical values. This implies that it will consider TRUE as 1, FALSE as 0, and text entries as 0, which will impact the overall variance outcome.
Note.
4. VARPA Function in Excel
VARPA determines the variance of a complete population and considers logical and text values of data. It should be applied in cases when every data point is present and non-numeric values have to be included in the analysis.
Note.
Part 3. How to Calculate the Sample Variance in Excel? Simple Guide
In Excel, it is easy to compute the sample variance with the help of the installed functions such as VAR.S or VARA. These functions aid in the measurement of the extent to which your data points differ with reference to the mean. To apply these functions to your Excel sheet, follow the steps below and learn how to find variance in Excel:
Calculating Variance Using the VAR.S Function
Step 1. Use an empty cell and start typing in the “=VAR.S” function. Open the bracket and select the values that you want to calculate, and close the bracket.
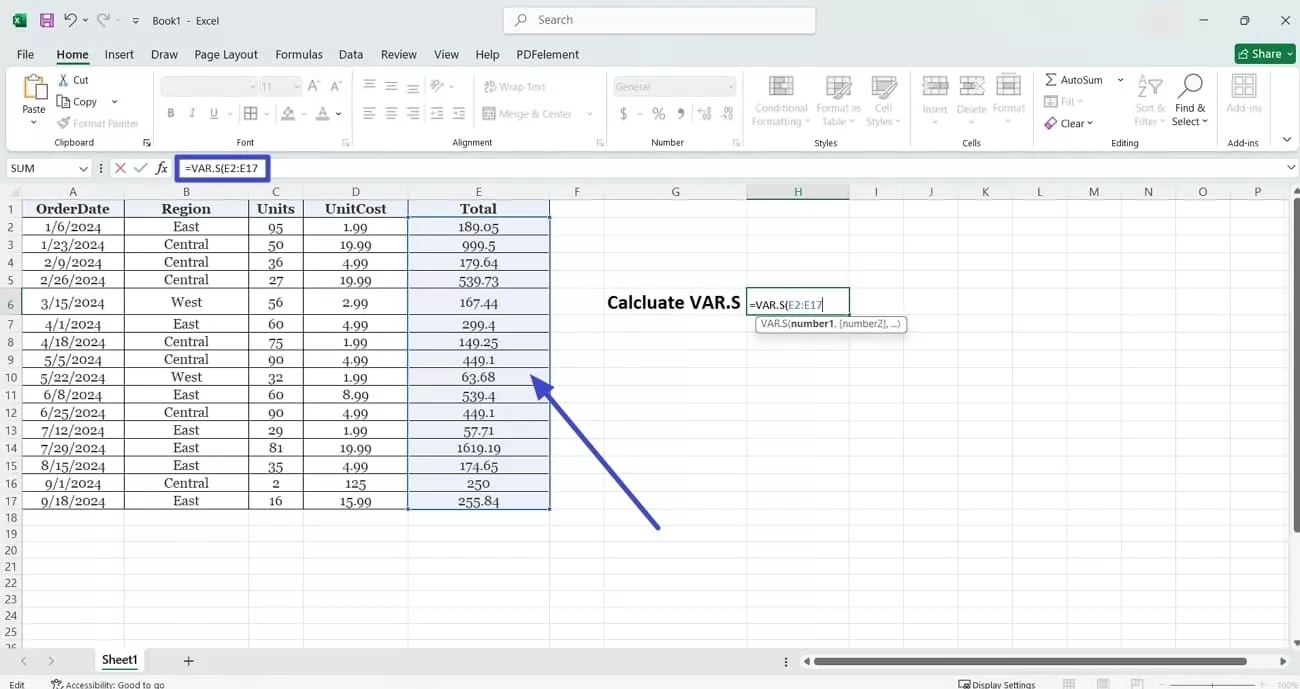
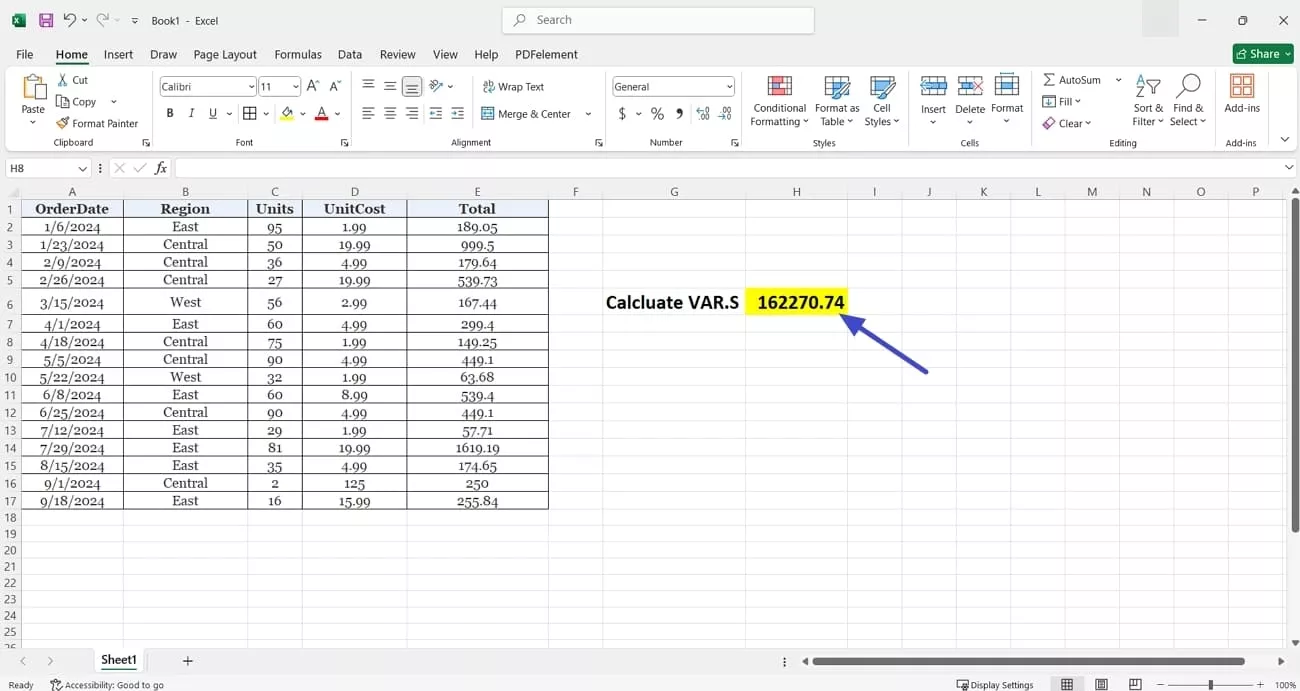
Step 2. Hit the “Enter” key on your keyboard to get the numerical variance value calculated using the VAR.S function.
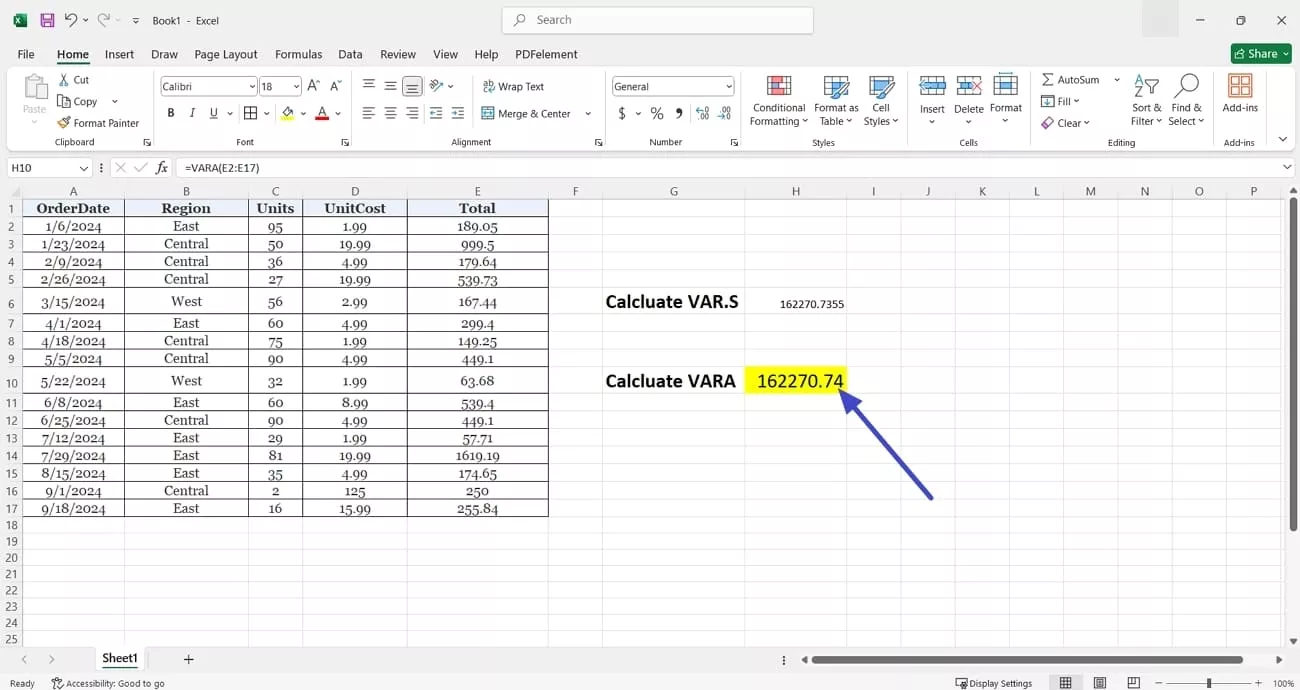
Calculating Variance Using the VARA Function
Step 1. Use a blank cell and type in the “=VARA” function and open a bracket to select the list of numerical data in the Excel sheet to close the bracket.
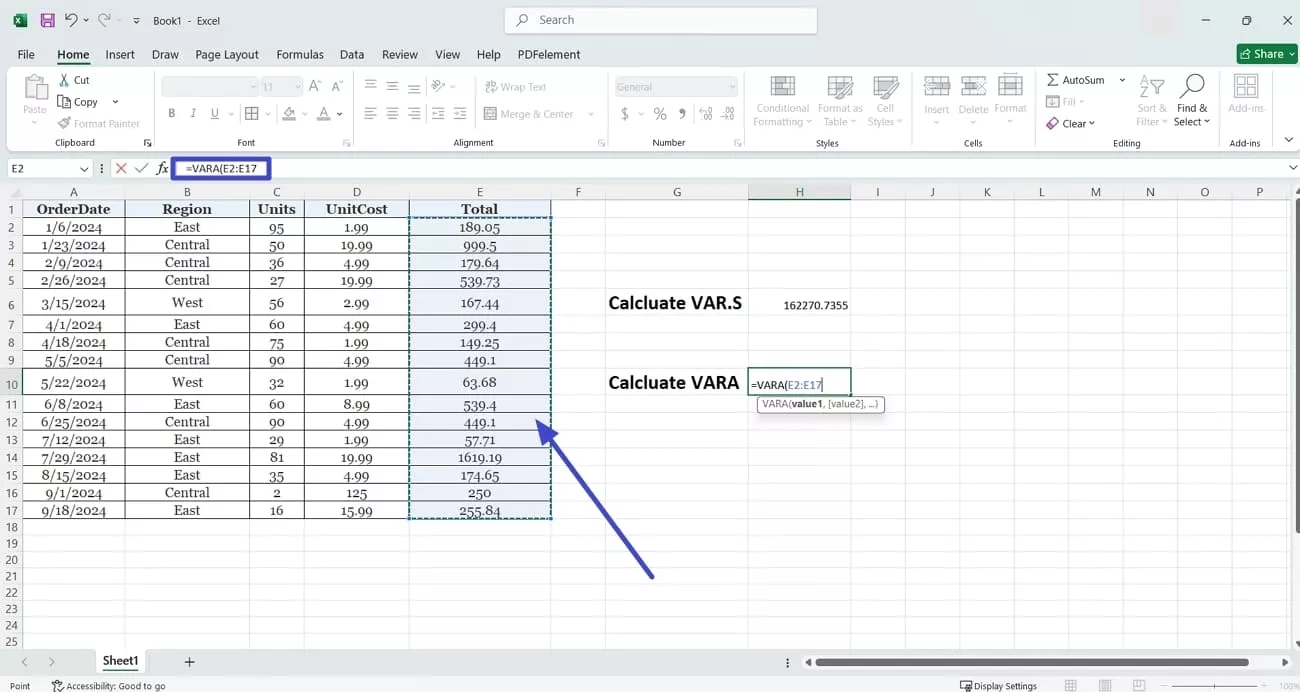
Step 2. Then, hit the “Enter” key on your keyboard to generate the VARA function variance calculation.
Part 4. Steps on How to Calculate the Population Variance in Excel
Calculating the population variance in Excel is possible using the VAR.P or VARPA function. These functions are applicable in the determination of the spread of data in a large population. Once you are done collecting the data, it is time to work out how to calculate variance in Excel by using the following steps:
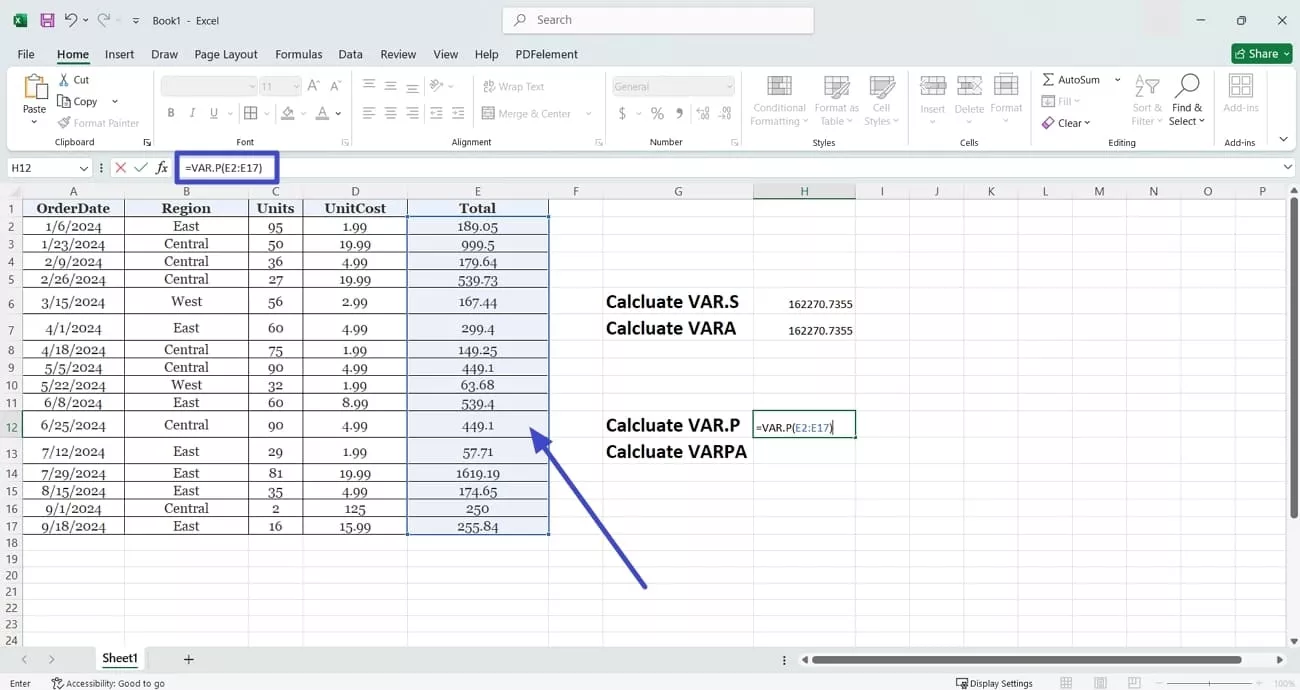
Calculate Population Variance Using the VAR.P Function
Instructions. Type the function “=VAR.P” into a blank cell and open a bracket to then close the bracket. Next, hit the “Enter” key to generate the calculated answer.
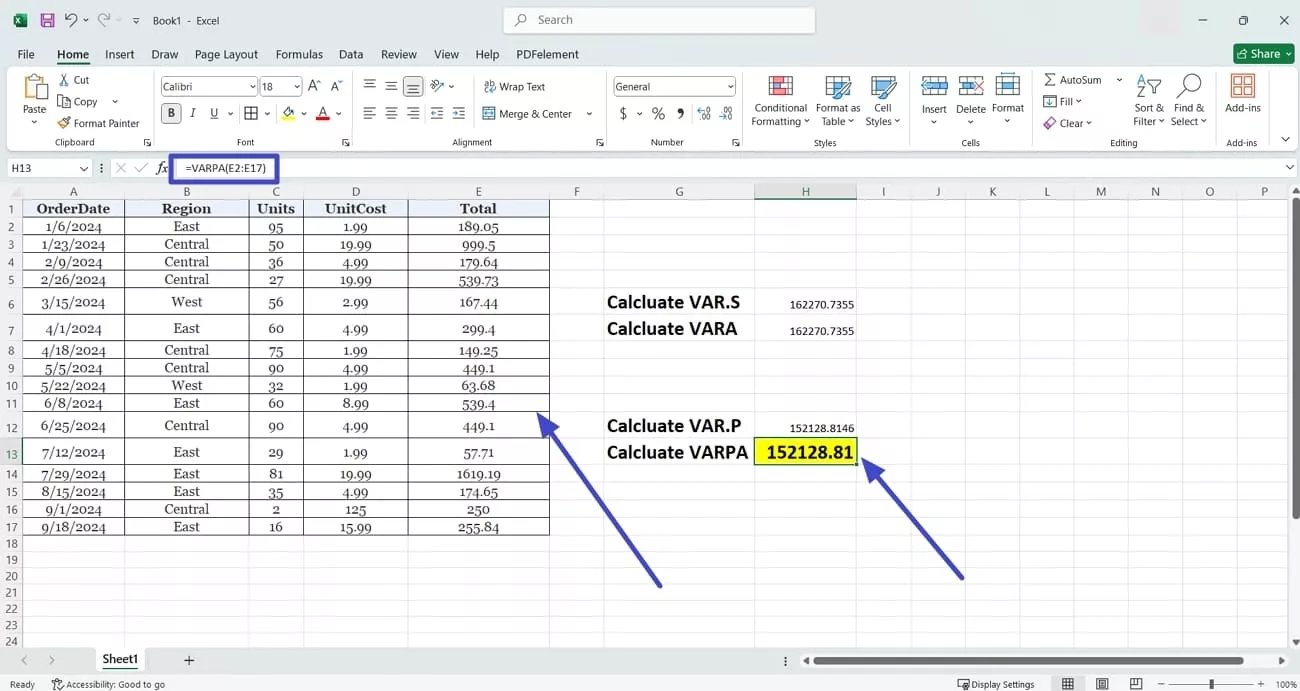
Calculate Population Variance Using the VARPA Function
Instructions. Now, to calculate the VARPA variance, type the population type in the “=VARPA” function and add the values into a bracket. Hit the “Enter” key to get the VARPA population variance numerical value.
Part 5. Understanding Variance via UPDF AI
While calculating variance values through Excel you do not get to learn the concept or the process that lead to the final answer. This makes it an ineffective learning method for students. Students need to refer to UPDF AI, which used sophisticated models such as GPT-5 and DeepSeek R1. It gives you a detailed understanding behind the working and the reasoning to the final answer.
It is compatible with both desktop and online versions, providing users with flexibility. UPDF AI operates with a user-friendly interface and is easy to navigate, to make sure professionals and beginners can use it with ease. Moreover, you get the ability to either type a prompt, add an image, or take a screenshot.
Windows • macOS • iOS • Android 100% secure
Understanding Variance Using UPDF AI Desktop
Learning how to calculate variance in Excel might be an ineffective method, which is why we introduce you to the advanced UPDF AI tool. It can help you perform the variance calculations immediately by providing detailed understanding of the concept. Here are the steps you need to follow to learn the calculation of variance using UPDF AI Desktop:
Step 1. Access UPDF AI on the Desktop Version
Initiate the process by launching UPDF, and then click on the “AI” button at the bottom middle of the screen.

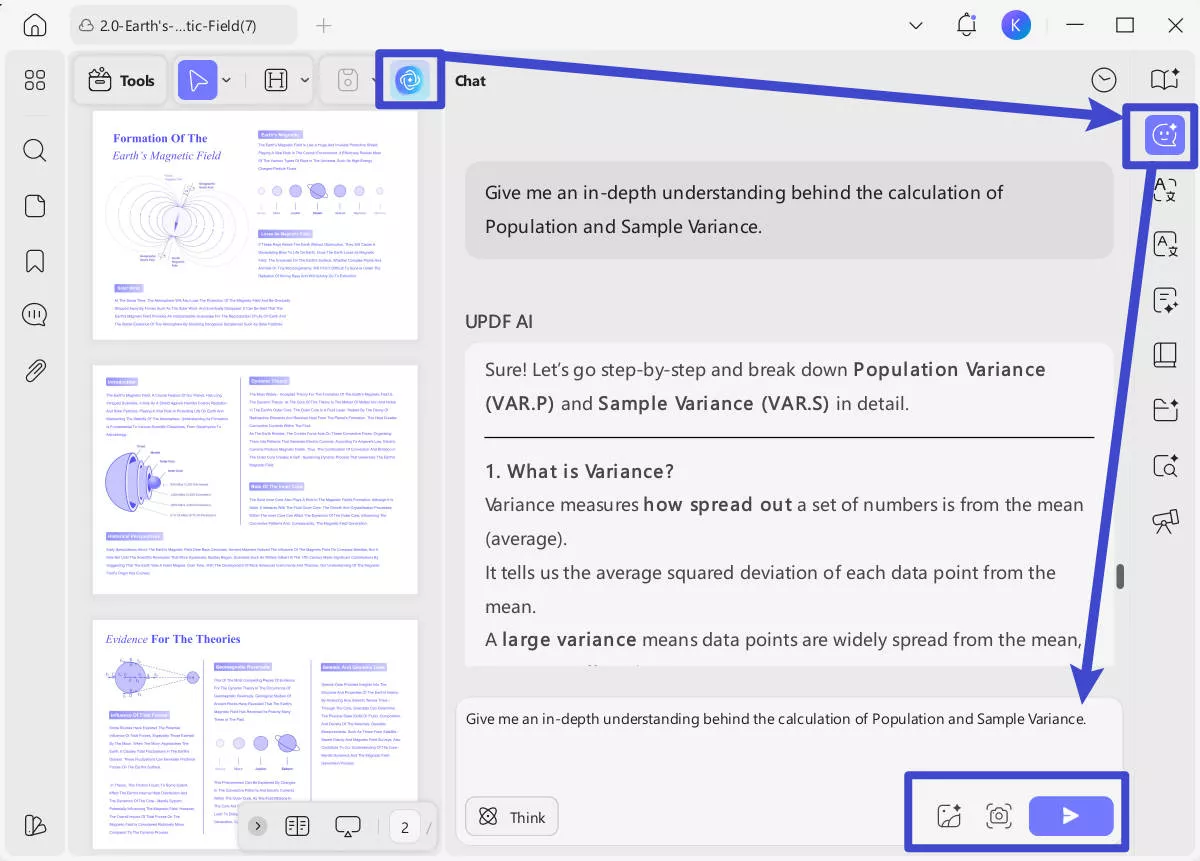
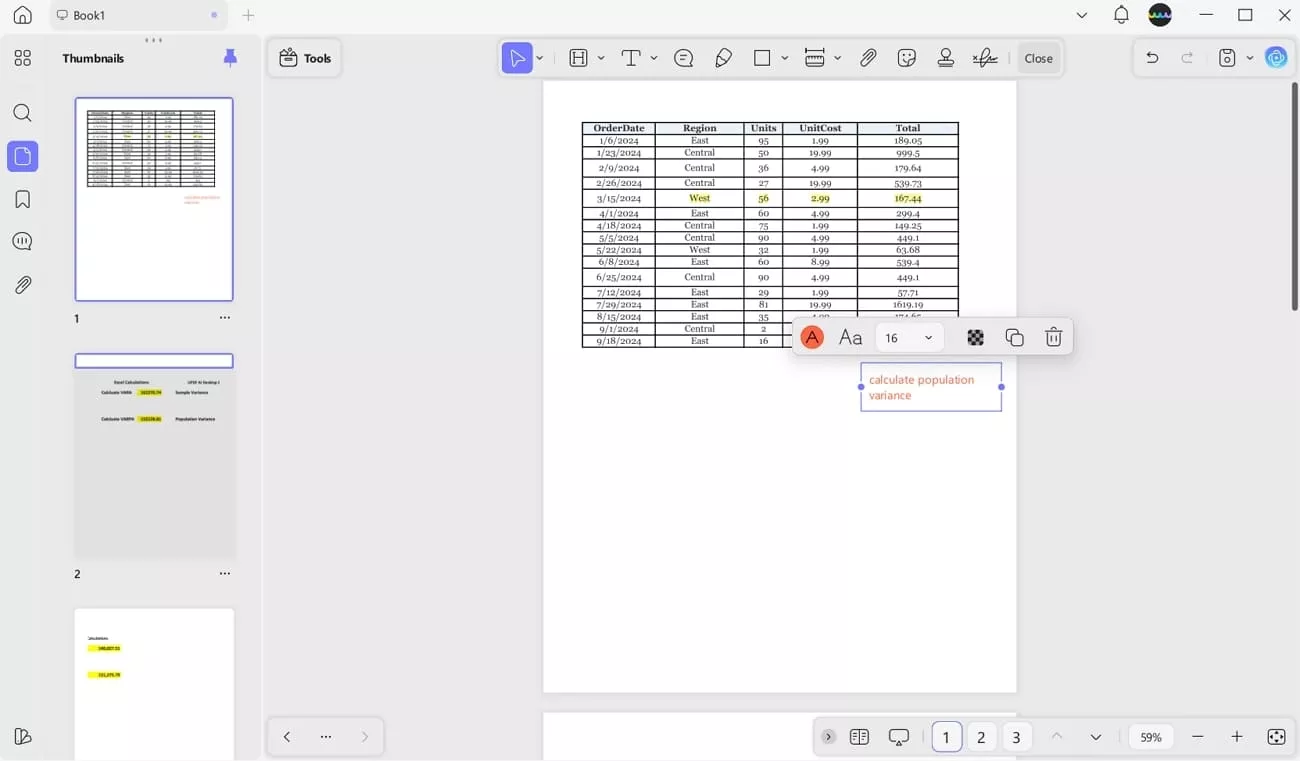
Step 2. Access AI Chatbot and Add in Prompt
Next, click on the “Chat” option and start typing in a prompt into the “Text box” in the right panel. If needed, choose the “Add Image” or Screenshot” option to add any details involving variance you want to understand as well before hitting the “Send” button.
Step 3. Preview the Details Provided by UPDF AI
Finally, go through the entire details that UPDF AI has performed and use them in your analysis.
Understanding Variance Using UPDF AI Online
Moving on, if you are looking for a quick understanding of variance online without having to download software, choose the UPDF AI Online tool. It allows you to generate an in-depth understanding towards the variance calculation using the UPDF AI webpage. Dive into the steps below to learn variance with the help of UPDF AI Online:
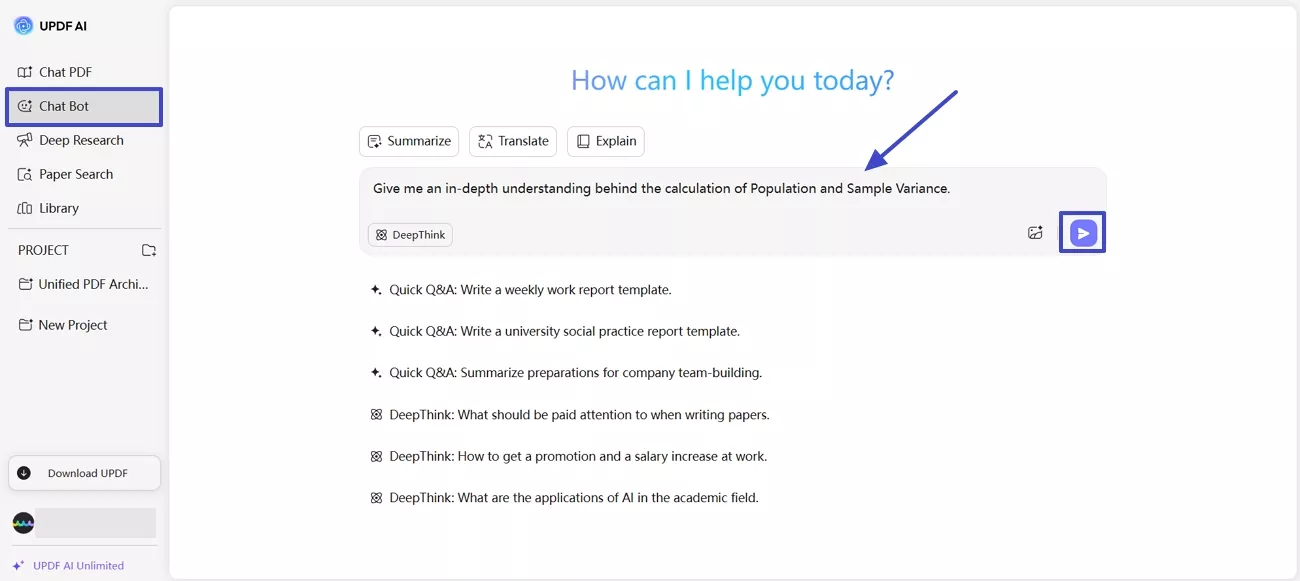
Step 1. Navigate to UPDF AI Chat Bot Interface and Type Prompt
Start the process by accessing UPDF AI on its official website and click on the “Chat Bot” option from the left sidebar. In the “Text Box,” start typing in the prompt and hit the “Send” button to generate a response.
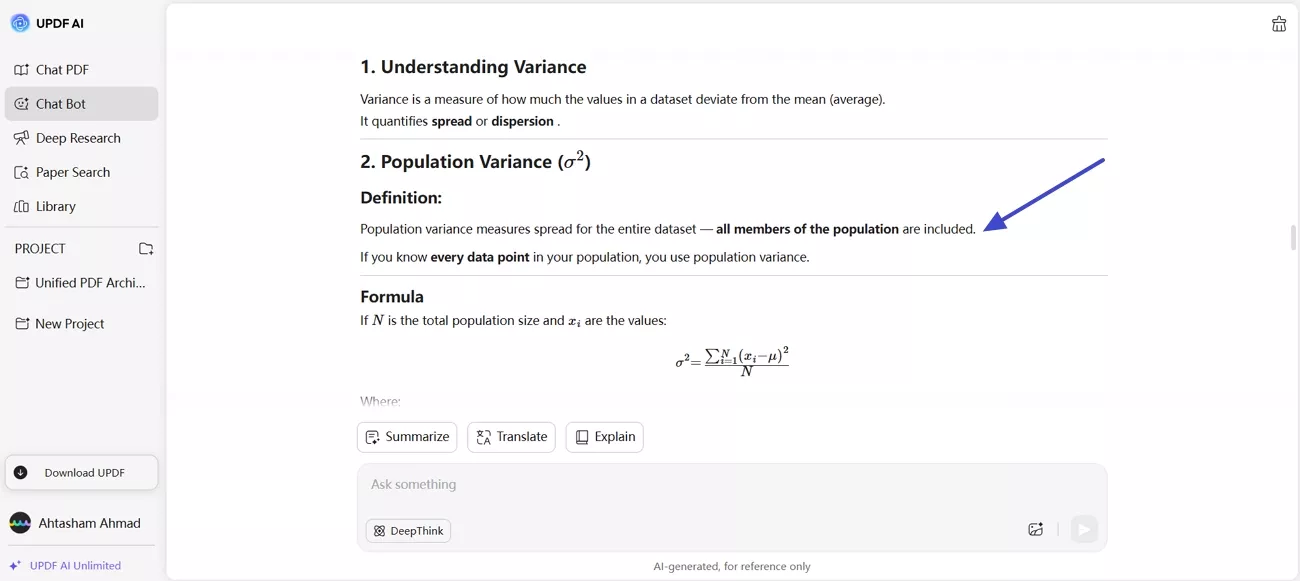
Step 2. Preview and Copy The AI-Generated Variance Details
Lastly, preview the variance details that the UPDF AI Chat Bot has generated to help understand variance.
UPDF AI Other Key Features
UPDF AI does not just generate understandings behind the mathematical calculations but also supports PDF users with the help of its advanced multiple features. Dive into this section to look into the other primary functions of UPDF AI that will enhance your overall PDF experience:
Windows • macOS • iOS • Android 100% secure
- Batch Conversion: You are able to turn Excel sheets into PDF on all devices without any loss in the original formatting. Multiple Excel files can be converted simultaneously with batch conversion, which saves time and effort. The layout is preserved to make sure that charts, tables, and formulas are preserved in the final PDF.

- Annotate Documents: Several different tools, such as highlights, comments, text boxes, and shapes, can be used to add annotations to variance reports. Users can label major insights, make clarifications, or visually highlight data trends. Such options of annotation make it much easier to work and to review analysis reports.
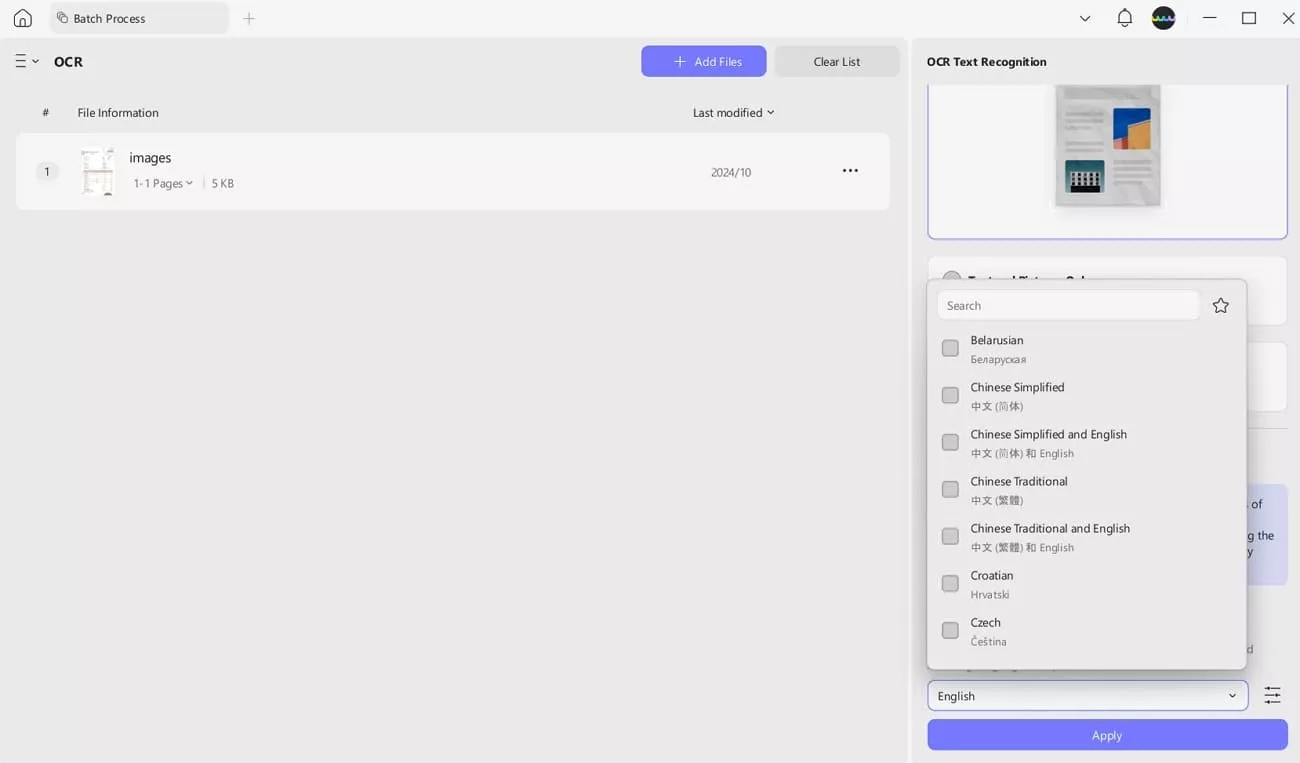
- Perform OCR: OCR can read over 38 languages and is highly accurate in reading numbers in scanned variance reports. Several languages are available in case the Excel has multilingual data. The process is rapid and convenient as batch OCR is available on all devices.
Conclusion
In conclusion, this article has looked into the basic understanding of what the calculator of variance is about and why it is important. We then discussed the 4 main variance functions that are used for calculations in Excel to help you get a better understanding.
Moreover, we provided you with a detailed guide on how to calculate variance in Excel, specifically for calculating population variance or sample variance. Apart from the basic variance concepts, we introduced you to an alternative tool, UPDF AI, that helps you understand variance with simple prompts.
Windows • macOS • iOS • Android 100% secure


 Enola Miller
 Enid Brown

 Engelbert White
MoneyInc